Management Effects on Low-Herb Diversity in Outlying Grasslands
|
|
|
- Margrethe Arnesen
- 5 år siden
- Visninger:
Transkript
1 Management Effects on Low-Herb Diversity in Outlying Grasslands Else Marte Vold Biology Submission date: May 2013 Supervisor: Asbjørn Moen, IBI Co-supervisor: Dag-Inge Øien, SN James David Mervyn Speed, SN Norwegian University of Science and Technology Department of Biology
2
3 1
4 Contents Abstract... 1 Sammendrag... 2 Introduction... 3 Determinant factors to plant distribution... 3 Land use history and current threat status... 4 Effects from land use on vegetation... 5 Conservation, management and research... 6 Study objectives and hypotheses... 7 Methods... 8 Study area... 8 Study species Study design Field survey and preliminary analyses Species observations Vegetation Moisture and ph Main data analyses Detection probability Effects of management and vegetation Results Density Probability of occurrence Discussion Main results Management and vegetation Effects of management on the environment and vegetation Species responses Qualities and drawbacks of the methods used Conclusions; conservation and management Acknowledgements References Appendix
5 Abstract During the past century there have been vast changes in land use, which have led to succession processes in outlying lands. As a consequence, species-rich semi-natural grasslands are disappearing and many of their associated species have become threatened with extinction. For targeted and successful conservation of these species, it is important to identify the ecological factors determining their distribution and abundance. The aim of this study was to reveal effects of different management types on the distribution and abundance of rare low-herb species, while controlling for vegetation type, moisture and ph. A case study was performed at Brekken, an upland outlying landscape in Norway. Seven study species were chosen; three Botrychium species (B. lunaria, B. boreale, B. lanceolatum), three gentian species (Gentiana nivalis, Gentianella campestris, Gentianella amarella) and one orchid (Nigritella nigra). Species observations were obtained by distance transect sampling. Within transects, present vegetation was recorded as intervals of distinct types, and moisture and ph was measured and used in characterization of vegetation types. Using generalized linear models and generalized linear mixed models, density and probability of occurrence was modeled in response to management (mowing, grazing and abandonment) and vegetation types. For all species in total, both the density and the probability of occurrence is higher in grazed areas than in mown and abandoned areas, and their habitat ranges are wider in the grazed area. From models fit per species, the gentian species show higher density or probability of occurrence in mown areas. Most of the studied species were shown to be at highest density and/or have highest probability of occurrence in low-grown grassland vegetation. Such grasslands are products of land use, and therefore management effects are in some species analyses assumed to be masked within significant effects of vegetation types. In restoration and conservation, type of management should be determined specifically for each site, based on local land use history and the overall conservation aim. 1
6 Sammendrag Mange tidligere slåtteenger og beiteenger i utmarka har i løpet av det siste århundret forsvunnet som følge av store endringer i landbruket og påfølgende gjengroing. Flere låge urter som er avhengige av slike habitat har blitt sjeldne eller truet av utdøing. For å bevare disse artene vil det være viktig å identifisere de økologiske faktorene som har størst innvirkning på deres forekomst og fordeling. Målet med dette studiet var å bidra med kunnskap om noen låge urters respons på ulike skjøtselsregimer, og samtidig kontrollere for effekter av vegetasjonstype samt fuktnivå og ph. En feltstudie ble gjennomført ved Brekken i Røros, i et artsrikt utmarksområde med arealer som skjøttes ulikt. Sju arter ble valgt; tre marinøkkelarter (Botrychium lunaria, B. boreale, B. lanceolatum), tre søtearter (Gentiana nivalis, Gentianella campestris, Gentianella amarella) og en orkidé (Nigritella nigra). Artsobservasjoner ble gjort i linjetransekt. I transektene ble vegetasjonen registrert som intervaller av ulike typer, og fuktnivå og ph ble målt og brukt i karakteristikk av vegetasjonstypene. Ved bruk av generaliserte lineære modeller og generaliserte lineære miksede modeller ble tetthet og sannsynlighet for forekomst analysert i respons av skjøtsel (slått, beite og gjengroing) og vegetasjonstyper. For alle artene totalt er både tetthet og sannsynlighet for forekomst høyest i beiteområdene, og spekteret av vegetasjonstyper hvor de har høy sannsynlighet for å forekomme er bredere i beiteområdene. Fra modeller for hver enkelt art er det tydelig at søteartene har høyest tetthet eller sannsynlighet for å finnes i slåtteområdene. De fleste av alle de studerte artene viser tydelig høyest tetthet og/eller sannsynlighet for forekomst i de lågvokste engtypene. Slike enger i utmarka er produkt av skjøtsel, og derfor antas effekter av skjøtsel på flere av artene å være skjult i vegetasjonsvariabelen, som oftere har signifikant effekt på tetthet og sannsynlighet for forekomst. Ved restaurering og bevaring av lågurtenger i utmarka bør passende skjøtselsregimer vurderes lokalt, i forhold til tidligere driftsformer og gjeldende bevaringsmål. 2
7 Introduction The abandonment or altered use of upland outlying lands during the past years has led previously prevalent semi-natural grasslands to disappear in such areas (e.g Dullinger et al. 2003, Walker et al. 2004). In the traditional land use, infields close to the farms in the lowlands were fertilized and cultivated, whereas outlying lands in the uplands were used for summer farming, haymaking and grazing (Austrheim et al. 1999). The outlying lands were thus characterized by patches of semi-natural habitats, partly formed and sustained by the moderate human influence (Diacon-Bolli et al. 2012). These semi-natural grasslands were inhabited by a variety of naturally occurring plant species. Changes in outlying ecosystems appear to happen at an ever more rapid speed as the traditional land use becomes more distant in time (Setten and Austrheim 2012). Many species are restricted to, or have seminatural grasslands as their main habitat, and are dependent on the traditional disturbance regimes (Gustavsson et al. 2007, Römermann et al. 2009). As these habitats have become rare, associated species may be prone to extinction unless restoration and management actions are taken, or the species are able to survive in secondary habitat types (Gärdenfors 2010, Kålås et al. 2010). There is often restricted knowledge on landscape complexity, ecological conditions and species niches associated with these grasslands. This may be a challenge for proper implementation of site-specific management preserving their full integrity (Barbaro et al. 2004). Determinant factors to plant distribution For semi-natural grasslands, land use and management are obvious disturbance factors governing the structure and species composition of their vegetation, and the distribution and abundance of their plant species (Bakker 1989). However, there may be a number of other factors interacting in determining this, on various temporal and spatial scales. These may be abiotic factors like moisture, solar radiation, soil ph, mineral and nutrient availability, snow cover, temperature and topography (e.g. Moser et al. 2005, Bennie et al. 2006, Cooper et al. 2011, Ceulemans et al. 2013). Biotic factors are important, such as intraand interspecific competition levels, facilitation, mutualism and parasitism levels, and life history, fertility and dispersal ability (e.g. Gurevitch et al. 2006, Dullinger et al. 2011). Biogeography is essential, through historic, current and potential geographic ranges (Lenoir et al. 2010). Processes of population genetics and dynamics interplay through for example density effects, metapopulation and source-sink dynamics, effects of demographic and environmental stochasticity, inbreeding, outbreeding and hybridization, and extinction vortices (Tanaka 2000, Munzbergova 2006, Sletvold et al. 2012). The intensity, character and range of the already touched upon disturbance are also important, e.g. traditional land use, herbivory, trampling, fire or extreme weather (Fuhlendorf and Engle 2004, Schlyter et al. 2006). Anthropogenous factors like global climate change, overexploitation, pollution, species introductions and habitat alteration, destruction and fragmentation have been 3
8 increasingly important during the human population growth, and will surely continue to be so (Eriksson et al. 2002, Carroll et al. 2003). Management of certain species may affect e.g. trophic interactions and ecosystem functioning (Ripple and Beschta 2003). The relative importance of all these factors to distribution and abundance of plants is species and site specific, and often also varies among seasons and years. Gradients of some of these factors, especially the abiotic ones, often correlate with altitudinal, latitudinal and longitudinal gradients (Moen 1999). Determinant factors are often mutually related, showing joint effects on plant diversity (Lorenzo et al. 2006). Plant species tend to occur where individuals can disperse to, germinate, grow and reproduce successfully, given their inherent traits and life history strategies (Gurevitch et al. 2006). Their population dynamics, distribution and abundance thus depend on their demands or tolerance levels to the above mentioned factors. Two important theories on this are Raunkiaers Life Forms on the position of meristems or regenerative parts of perennial plants (Raunkjær 1934) and Grimes C-S-R model on main selective pressures posed to plant populations (Grime 2001). Land use history and current threat status Land use forms including grazing of domesticated or semi-domesticated animals have been dated back to the Bronze Age in Scandinavia, and increased through the Roman and Migration periods (Hjelle et al. 2006). Further use of the uplands in this region varied slightly between areas in form and intensity due to both natural and cultural factors (Almås et al. 2004). At least from the 1600s onwards, land use was intensified, and summer farming in the upland outlyings was by then an important part of land use in many areas (Olsson et al. 2000). The uplands were used for grazing, harvesting of grasses and herbs, foliage and lichens for winter fodder, and for fuel-wood cutting. The outlying lands were thus invaluable as they were limiting for the size of the livestock a farm could hold throughout the year, and further, the area of arable land which could be fertilized with manure (Moen 1990). In this region, the intensity of traditional land use and exploitation of outlying lands peaked in 1850 (Reinton 1955), after which it declined, especially in the first half of the 1900 s. By 1950, economic and social conditions for traditional land use practices had become unfavorable (Setten and Austrheim 2012). The concurrent land use change involved intensified use of the most productive and accessible lands, which in mountainous regions most often were the lower-lying lands close to the farms (Prévosto et al. 2011). Intensification involved mechanization and use of commercial seeds, artificial fertilizers, herbicides and pesticides (Eriksson et al. 2002). This resulted in homogenization of the vegetation in formerly traditionally mown lowland fields (Ross et al. 2012). Outlying uplands were mostly abandoned or used for other purposes. Abandonment and associated loss of disturbance effects was the onset of vast changes in the vegetation of the uplands, through encroachment of tall grasses and herbs, shrubs and trees (Dullinger et al. 2003). Some areas 4
9 have been continued to be used for grazing, however in formerly mown fields this has altered ecological conditions and species composition, as grazing and mowing have different effects (Maurer et al. 2006). In addition, such pastures have often been fertilized to increase grazable biomass in a restricted area, further disrupting former conditions (Schellberg et al. 1999). Finally, sale or government claim has also altered the character and biological communities of outlyings, e.g. through development of hydroelectric power reservoirs or spruce forest plantations (Lindgaard and Henriksen 2011). Current threat factors to semi-natural grasslands thus include loss, degradation and fragmentation of area through succession or altered use. Even management is sometimes a threat, as timing or methods of actions may be wrongly applied to certain sites. In the remaining semi-natural grasslands, there are negative trends in their integrity. Threat factors are given in the first Norwegian Red List for Nature Types (Lindgaard and Henriksen 2011), in which semi-natural grasslands are categorized as vulnerable (VU), and the subtype traditionally mown grasslands is categorized as endangered (EN). The latter receives attention and effort through a national level Plan of Action for conservation and management (Norderhaug and Svalheim 2009). Loss of this habitat type has adverse implications for associated plant species. Populations become smaller, fewer and more fragmented (Eriksson et al. 2002). Lower genetic variability is probable to pose populations to more inbreeding, genetic drift and serious effects of environmental and demographic stochasticity. All these negative impacts may lead populations into extinction vortices evil circles of such effects driving populations and species towards extinction. In Norway, there are at least 300 species of vascular plants associated with semi-natural grasslands, and in total 741 threatened species having these as their main habitat (Norderhaug et al. 1999, Kålås et al. 2010). This underlines the species richness and conservation value of such habitats. Effects from land use on vegetation Throughout the hundreds of years of traditional land use, the landscape and vegetation of the uplands was influenced by human and livestock activities (Almås et al. 2004). Fens, heathlands, grasslands and floors of thinned woodlands were kept open and low-grown. Aboveground biomass was regularly removed, which prevented accumulation of litter, and created spatial gaps in the plant community. Thus light availability in the field layer was maintained. Competition level was reduced, providing conditions also for less competitive plant species (Øien and Moen 2006). Where there was grazing, trampling and fertilization would affect the nutrient availability and soil conditions. The hay was dried on the ground, or in hay stacks and hay barns. The timing and methods of the haymaking was beneficial for many species dispersal. The farmers knew at what intensities the grazing and mowing provided long-term optimal yield at different sites (Moen and Øien 2012). Overexploitation would reduce the productivity of the area and harvest output in the following years. 5
10 This low to moderate level of land use disturbance set the scene for the co-existence of many species, and the semi-natural grasslands of the outlying lands were amongst the most species rich plant community types of Northern Europe (Kull and Zobel 1991). This conforms the intermediate disturbance hypothesis, which predicts highest species richness at intermediate disturbance levels in a given area (Speed et al. 2012). The patchiness of land use regimes created a scattered distribution of different habitat types and communities throughout the landscape. Thus there was high diversity at several scales. The current situation for most previous semi-natural grasslands is either minimal disturbance or high disturbance, both resulting in homogenization of vegetation and decreased species richness in the outlying lands. Succession processes may commence immediately after a grassland area has been abandoned, the rate dependent on the productivity and the length of the growing season in the area, and the surrounding vegetation (Öckinger et al. 2006). The resulting increase in shrub and tree cover is recognized as one of the main threats to semi-natural grasslands and associated species (Pykälä et al. 2005). The decrease in species richness in such grasslands is also due to an increase in nitrophilous tall herbs and grasses, which out-compete low-grown species as nutrient availability increases after cessation of traditional land use practices (Krahulec et al. 2001). The succession processes may be reversible if restoration and management actions are taken before propagule banks or potential source populations are lost and (Öckinger et al. 2006, Cousins and Aggemyr 2007). There is an urgent need to determine the underlying factors that control plant species richness and composition in managed grasslands (Klimek et al. 2006). Conservation, management and research Some would still argue that conservation of a partly human-created nature type by maintaining its vegetation at a specific successional state is wrong or pointless (personal discussion experience). However, there is increasing recognition of the current disappearance and threat status of semi-natural grasslands, and increasing acknowledgement of their conservation value (Austrheim et al. 1999, Blackstock et al. 1999). In addition to being reservoirs for biodiversity, semi-natural grasslands provide several ecosystem services, have important educational and recreational value and represent a large part of European natural and cultural heritage (Speed et al. 2012). Norwegian governments have assigned seminatural grasslands high management priority as a selected habitat type for the Nature Diversity Act (Lovdata 2009, Norderhaug and Svalheim 2009). Proper management of protected areas, vulnerable species and nature types is dependent on basic knowledge of the environmental conditions under which they are found in their characteristic condition. One way to study the integrity (or lack of integrity) of semi-natural grasslands is to evaluate the status of their characteristic species, especially the least common ones. The more species surveyed, the better the knowledge foundation for evaluation (Randin et al. 2006). 6
11 Targeting conservation priorities to areas of particularly high species richness is important, as this often will preserve both regionally rare species and all species found in the less species rich areas (Myklestad and Sætersdal 2003). Choice of species for a specific site should be based on knowledge on historic distribution ranges. Investigation of occurrences in the field by crawling through an entire area is rarely desirable or effective, and for large scale distribution analyses there is often need for estimation and prediction. Research on rare species and plant communities have in the past few decades included methods like transect sampling. Line transect sampling is a survey method that permits adjustments for differences in detectibility among sites (Thomas et al. 2010). This is an important quality, as there may be several factors affecting the probability to detect species individuals, like surrounding vegetation, plant traits etc. Transect sampling can at the same time be used to survey changes in vegetation through environmental gradients (Sutherland 2006). Correlative studies on species occurrences and environmental factors are essential for prediction (Suding et al. 2008). Species distribution models are useful for predicting future scenarios of effects on habitats and species of land use change and climate change. If used cautiously, these are potentially important tools for conservation and management of biodiversity (Keith et al. 2008). Study objectives and hypotheses The main intention of this study was to contribute knowledge on the effects of management and the lack of it on distribution and abundance of rare low-herb species associated with semi-natural grasslands. Answers were sought through a case study in mown, grazed and abandoned sites in the vicinity of Brekken, Røros. This is an upland area of high species richness, and it represents a diversity of habitat patches, communities, species and current and historic management regimes. As management is unlikely to be the sole determining factor for species occurrences, another important aim was to control for confounding effects of the two main ecological gradients in the study area; moisture and ph (Moen 1990), and vegetation type, reflecting species composition and light availability. Within the relatively small though diverse landscape at Brekken lies a unique opportunity to investigate effects of ecological factors on populations of rare plant species, as large-scale factors like climate and weather can be assumed equal throughout the area. Two main hypotheses were outlined; (1) Rare low-herb species show higher abundance in managed areas than in unmanaged areas, and there is variation in management type preference among species. (2) Rare low-herb species show preferences in moisture and ph levels expressed through variation in distribution and densities between vegetation types. 7
12 Methods Study area The following description follows Moen (1990), Øien and Moen (2006) and Moen and Øien (2012), in which more detailed descriptions can be found. The study area is located in the vicinity of Brekken in Røros municipality, Norway (Fig. 1). Sølendet nature reserve is part of the study area, along with areas a few hundred meters south of the reserve. Study sites lie in the altitudinal range of m.a.sl., and the base rocks mainly consist of grey-green phyllite. The area lies in a transition between the middle boreal and north boreal vegetation zones, and the climate is weakly oceanic to intermediate between oceanic and continental. The growing season is short, lasting approximately from late May to late September. There are several native herbivores using the areas, e.g. ungulates, hare, rodents, birds and insects, and seasonally migrating semi-domestic reindeer pass through every year. There is a geologic transition within the study area at about 706 m.a.s.l. At altitudes above this level, soils are affected by basic moraine sediment, whereas at lower altitudes the sediments are mostly fine-grained, poorer sand. Most of the nature reserve is on the base rich moraine soil, whereas the lowest part of it and areas between the reserve and lake Aursunden are on the sandy soil. However, the total study area is a hydrological unit, as it is affected by calcareous ground water (ph>7) emerging from springs in the upper and middle parts of the reserve. In the lower parts of the reserve and the areas to the south, this water is aggregated in small brooks and valleys. Some of the valleys are wet during the whole growing season, while others are quite dry except during spring flood and wet periods. The lowest part of these valleys mostly drop only a few decimeters to a few meters below the surrounding grounds in altitude. The upper parts of Sølendet nature reserve are characterized by large areas of rich fens, wooded grasslands and wooded heathlands. In the lower part of the reserve and the areas between the reserve and Aursunden, there is a general vegetation pattern of rich grassland vegetation in the valleys, separated by poorer heath, scrub and birch woodland. Mown areas are found at Sølendet, while abandoned and grazed areas are found in the areas to the south of the reserve. The grazed area is delineated by a fence. The furthest distance between study sites within the total area is 2.4 km. At least from the 1600 s onwards, Sølendet was an important haymaking area. Amazingly, 100 tons of hay was probably the average annual harvest here. About 30 persons would stay at Sølendet throughout the summer, conducting a total of approximately 1000 working days per year. After a gradual decrease in intensity through the first half of the 1900 s, traditional haymaking at Sølendet ceased around The currently abandoned and grazed areas were formerly grazed mostly by goats. At least since the early 1980 s, grazing has been by 8


13 cattle in the grazing area, and land use has been ceased in the abandoned area (Per Langøien, personal info). Sølendet has long been known as of high botanic value, especially due to the high diversity and abundance of orchid species. When the nature reserve was established in 1974, this area had been abandoned for a relatively short period compared to other sites. Also, succession runs slow at these altitudes, due to the short growing season. Therefore it seemed possible to restore Sølendet to a somewhat authentic state. Several formerly mown sites at Sølendet and formerly grazed sites in surrounding areas were by the 1970 s colonized by various tall herb, shrub and tree species. This process was particularly rapid in fen margins and former low-herb grasslands. After the protection of Sølendet, immense efforts were made in the clearing of trees and shrubs and mowing in large areas. By the end of 1986 the restoration clearance was largely completed, and from then on, regular mowing and clearing of windfall has kept the reclaimed areas open. Grazed grassland areas south of the reserve were cleared of encroaching shrubs from 2005 to Long-term studies in the area commenced in 1974 and have been continuous until present. Monitoring through years pre and post restoration and management has provided a good understanding of changes in vegetation and many species populations following management and the lack of it. Management plans have been developed for Sølendet, and research is continuously increasing the knowledge basis for adjustments. Scientists, managers, authorities, landowners, local people and tourists are now cooperative and active users of the study area in research, conservation, education and recreation. a) b) Figure 1: a) Location of the study area (map: Dag- Inge Øien) and b) aerial photo of the study area with management areas and transects shown. The blue dots indicate ground water springs, blue lines show brooks and gray lines are altitudinal curves. The uppermost parts of the reserve are at 800 m.a.sl., and lake Aursunden, partly seen to the bottom left, is found at 690 m.a.s.l. 9
14 Study species The criteria for choice of study species were that they should (1) show habitat preference to semi-natural grasslands, and (2) have been observed within the study area. Seven species were chosen altogether, from three plant families. Red list status for the study species are given in Table 1 (see Kålås et al for cirteria). Table 1: Status for the study species on recent Norwegian Red Lists for Species (Kålås et al. 2006, Kålås et al. 2010). Red List B. lunaria B. boreale B. lanceolatum G. nivalis G. amarella G. campestris N. nigra NT - - NT EN 2006 NT NT EN - NT NT EN The following description largely follows Berg et al. (1990), Lid and Lid (2005) and Elven et al. (2013). Habitat preferences of the chosen species are mainly traditionally mown or grazed grasslands and summer farm grounds. They are also to be found in unmanaged alpine grasslands and hillsides, which often have similar properties to the lower-lying semi-natural grasslands. As semi-natural grasslands have become rare in recent decades, the study species have disappeared from many such sites. They are now often only to be found in alpine habitats and secondary site types, such as road and path verges, or otherwise slightly disturbed, basic soils. Viability and size of propagule banks in the soil is important to the distribution and abundance of these species, and to successful restoration of their populations. Seeds or spores of all study species are fortunately very small, and assumingly not preferred food to granivores (Gurevitch et al. 2006). Botrychium lunaria is, as the two following Botrychium species, a perennial herb reproducing by spores. Plants of the three included species are all pale to medium green or yellow-green, relatively small and inconspicuous. The plants grow throughout the summer, and by late summer the spores have matured and sporangium walls become orange or brown in color. B. lunaria is usually 3-15 cm in height, but can grow to at least 21 cm at Brekken, Røros. The aboveground part consists of a single stalk which is divided into a spore-bearing segment and a vegetative portion at about half the plant height. The vegetative portion is deeply dissected and has pairs of kidney-shaped, undivided leaflets along the main nerve. It is distributed through nemoral to mid-alpine vegetation zones in cirkumboreal and bipolar regions. In Norway, this species is generally the least rare of the Botrychium species, and is found in most parts of the country. Botrychium boreale is usually 3-17 cm in height. Plants appear a bit more compact than B. lunaria, in the sense that the division into vegetative and spore-bearing segments takes place further up on the stalk, and both segments are subdivided. Both the whole vegetative portion and the single leaflets appear triangular in shape, and the latter often overlap. B. boreale is slightly more alpine than B. lunaria. It has an amphi-atlantic distribution through low-alpine to northern boreal zones. In the southern part of Norway it is only found in mountainous areas, but from central Norway northwards it goes down to the shore line. 10
15 Botrychium lanceolatum is most often 3-12 cm in height. The segment division is high up on the stalk. Compared to B. boreale, the triangular shape of the vegetative portion is more equilateral. The colour is slightly more yellow and the leaflets do not necessarily overlap. The leaflets for both the vegetative and spore-bearing segments are longer, narrower, and dissected more deeply. The stalk is often red to brown furthest down and at one side. B. lanceolatum does not require as base rich soils as the two previously mentioned Botrychium species, and can be found in coastal sand dunes. Nevertheless it is one of the first species to disappear when grazing or mowing ceases in its habitat. Globally it has a scattered distribution through middle boreal to low alpine zones of the cirkumboreal regions. In Norway this is the most rare of the three mentioned Botrychium species, categorized as near threatened on the red list. Gentiana nivalis is an annual herb dispersing by seeds. As a consequence, also holding for the two following gentians, distribution and abundance may vary greatly among years. G. nivalis is at Sølendet found to reappear after years of yearly mowing of tall-herb grassland generated by succession. G. nivalis grows to 3-24 cm, depending on the altitude and conditions in the habitat. The stalk may be branched or not, the leaves are small and elliptic, and the calyx has dark edges. Flowering is in mid to late summer. The five-petaled flowers are small and bright blue, or more rarely white, and open only in sunlight. This species is one of the more alpine of the study species, and thus is not yet especially rare though it is losing semi-natural grasslands as habitat. G. nivalis is an amphi-atlantic, arctic species, found through the middle or northern boreal to middle or high alpine zones. In southern Norway it is found mostly in upland and alpine areas, though in northern parts it also grows in the lowlands. Gentianella amarella ssp.amarella is a monocarpic biennial herb species, of which plants form only a rosette the first summer and then flower, set seeds and die the second summer (Huhta et al. 2003). Plants usually grow 5-25 cm tall, however at Brekken, Røros individuals have been measured to 34 cm. Stalks may be branched or not, and the leaves are quite narrow and lanceolate. Flowering is in mid to late summer. The corolla is usually fivepetaled, mm long and colored violet to white. In addition to the main habitat, it is also found on scree slopes and ledges of south facing cliffs, and in sand dunes and coastal grassy heaths. G. amarella probably has two subspecies and several seasonal races. Subspecies amarella is found through boreonemoral to low alpine zones in Europe and West Siberia. The Norwegian distribution is strange, not resembling any other species. In the southern part it is found on the eastern side of the central mountains. In the midst part it is found from the coast to the eastern border, and further north it is most often found as coastal. Gentianella campestris ssp. campestris has similar life history to G. amarella (Lennartsson and Oostermeijer 2001). It also resembles G. amarella in growth form, appearance, size and habitat. Its leaves are a bit wider and slightly more egg-shaped. For G. amarella the four aggregated leaves at the flower base are about equal in length, whereas the corresponding 11
16 leaves for G. campestris are two very small which are merely hidden by two larger. The flowers are a bit larger, often in a slightly paler lilac color, or more rarely white. Flowering is in mid to late summer. It is otherwise found in nemoral to low alpine zones in Europe. In Norway this species used to be found quite frequently throughout the country, but it has become a rare sight in the lowlands of the southern part. Nigritella nigra spp. nigra is a perennial orchid species. Each year individuals renew their above-ground plant parts from root tubers. Flowering individuals appear in mid-summer. They most often grow cm tall, though at Brekken, Røros, heights between 7 and 27 cm have been recorded. The flowers are small, dark red and numerously aggregated in heads which scent of vanilla. Reproduction is apomictic, and each flowering individual produces about 4000 small seeds. In a given growing season, considerable proportions of populations live in a non-flowering vegetative state. It may take many years for individuals to emerge from the ground, and further to reach the flowering state. Post flowering, individuals may stay sterile for some years before they flower again, if they flower again. Flowering and grazing by rodents are the main causes of plant death in this species. Its dispersal ability is probably low, as mowing and clearing of shrubs alone does not seem to increase population sizes (Moen and Øien 2002). Population processes are thus complex, tedious and sensitive, and require long-term monitoring. N. nigra is found in a variety of habitats, and natural development and ecological requirements are not fully disentagled. However the largest populations are found within low-grown grasslands in upland and low-alpine areas. There is a close relationship between Nigritella and Gymnadenia, and some authors include N. nigra in the latter genus. N. nigra ssp. nigra is a Scandinavian taxon, found in boreal-alpine zones of Sweden and Norway. In Scandinavia it has an interesting bicentric distribution, as it is found mainly at the eastern side of the central mountain region in southern Norway, and in a few localities in Troms. One of the largest populations in Norway is found within the study area at Brekken, and is estimated to consist of about 3000 individuals (Moen and Øien 2012). It is proposed as prioritized species under the Nature Diversity Act, and an action plan has been drawn up (Moen and Øien 2009). Study design For site selection within the study area it was important to include as much low-grown grassland vegetation as possible, but also to include large areas of other vegetation types. The vegetation type in a particular site often reflects the present ecological conditions, e.g. soil moisture and ph and light availability at ground level, and vice versa (Klimek et al. 2006) Therefore, investigation of many vegetation types would be needed for a study of relationships between ecological gradients and species responses. Selection of sites was based on vegetation maps and knowledge about the present and historical land use practices and management. The grassland vegetation was the basis for selection, and other vegetation types were included as being edge vegetation of these. The chosen grassland 12
17 sites have until the end of the previous growing season (2011) experienced at least three decades of either regular mowing, regular grazing by cattle or abandonment. Mowing and grazing was in the summer of 2012 postponed about 2-3 weeks from normal timing, to make the field work for this study possible. Distance line-transect sampling was considered the most suitable and efficient method, as it allows for quite productive sampling when time is limited (Sutherland 2006). There was only one observer, therefore no among-observer variation. This method provides unbiased plant species density estimates for surveyed sites if these key assumptions are met: transect placement has an element of randomization, distance from transect line to individual is accurately measured, and all individuals on the transect line are detected (Thomas et al. 2010). Transect lines with endpoint coordinates were determined prior to the field survey. Grassland sites were limited, and as large parts of them as possible were needed for the study. However it was crucial to prevent overlapping transects and observations. Distance between transect lines was therefore set to 25 m for gentians and Botrychium species and 50 m for N. nigra. In ArcGIS 10.1 (ESRI 2011), an aerial photo of the study area was overlaid with a map of the grassland vegetation and a 25 by 25 m UTM coordinate grid. As the valleys in the grazed and mown areas run more or less north-south, transects were determined to run east-west across the valleys. This was done to get several transects within in each valley and be able to detect possible within-valley (among transect) differences, and to include several vegetation types within each transect. However, the valley in the lower part of the nature reserve runs east-west, and for the same reasons, transects here were determined to run north-south. Grasslands which did not have this characteristic valley shape (upper and mid parts of the mown areas), were assigned east-west-running transects. Transects were lined in parallels by every 25 m, drawn beyond the edges of grassland vegetation to the nearest rounded 50 m of the grid or to natural endpoints when running into a road, pond or fence. Thus the valley transects included dry vegetation types at the edges, grassland vegetation in the slopes of the valleys, and more or less damp vegetation in the lowest lying parts of the valleys. Edge vegetation of the grasslands in the upper and mid parts of the nature reserve often included dry scrub- or woodland or fen margins. All grassland vegetation within the transects in the nature reserve is regularly mown. Codependent transects (i.e. those within the same valley or site) within each management type were grouped into blocks. The distribution of transect meters, transects and blocks on management types are shown in Table 2. Table 2: Total transect length, number of transects and number of blocks measured in the field, distributed on, and across, the management type areas. Mown Grazed Abandoned Total Total transect length Number of transects Number of blocks
18 Field survey and preliminary analyses Species observations The predetermined transect endpoints were located in the field using a handheld GPS device (Garmin 2010). At the starting point of any transect and regularly while walking, a compass was used to find and correct the direction of the transect. A few pilot transects proved this to be more accurate than using GPS at the small scale of the present study. Each transect was walked from one end to the other while looking for individuals of the study species. The speed of walk was from the pilot studies determined to about 1 m/min. Observation was carried out only while standing up straight, looking in all directions. Individuals which were spotted during other activities than such observation from the transect line (e.g. measurements of individuals at ground level), were not included. Limitation of observer trampling effects was always strived for. For each individual, the coordinates for the perpendicular point along the transect line was recorded. As was the distance from this point to the individual. Measured plant traits were specific to each of the three plant families, as they differ in importance for detection probability. Plant height and area of vegetative portion ( leaf length x width /2) was recorded for the Botrychium species. For the gentians, plant height, number of flowers, number of open purple flowers and number of branches emerging at ground level was measured. Plant height was the only measure for N. nigra. Only fertile individuals were recorded for the study species, as detection of individuals in sterile, vegetative stages is quite difficult. Date, time and weather was noted for all observations. Normally, individuals were recorded during walking of the transects. However at some sites there were relatively high densities of individuals, requiring application of a slightly modified observation method. Here, all individuals seen from the transect line were first marked with a stick, and then revisited for measurements. This was done to prevent duplicate records of individuals, confusion on which individuals were actually detected from upright position at the transect line, and to hold weather conditions as constant as possible for each transect. As N. nigra is the earliest growing and flowering of the study species, the first round of transect walks was done looking for this species. The Botrychium species were objects for the second round, and the late-flowering gentians the third round. This separation of species groups was necessary to be able to observe for the species at their specific growth and/or flowering peaks, and to see them at similar stages in all management types and transects. Trampling from the first and second round may have had impact on detection in the second and third round, especially at the transect line. However effects were considered negligible, and therefore not measured. 14
19 # transect meters Vegetation Vegetation types within transects were recorded in the beginning of August. This was done after the survey on study species, to minimize trampling effects on those observations. Within each transect, intervals of distinct vegetation were noted using the GPS. Dominant species and other typical species were identified. Species richness, soil moisture and approximate height and cover of field and shrub layer was estimated by sight. Present vegetation was divided into 12 different types largely following the divisions and descriptions used in the vegetation map of Sølendet nature reserve (Moen 1990), in which moisture and richness (reflecting ph) are applied as gradients in type classification. For a few vegetation types, field notes (observer perceptions) were the only clue for their placement amongst the other types. Vegetation types are described and defined (see Table 3). Observations within vegetation type 12 were excluded from further analyses, due to absence of study species and lack of moisture and ph measurements within these areas, and also its unnatural state due to nutrient influx from modern agriculture. This vegetation type was only found in the abandoned area, thus the number of transect meters in this management type and the total area was reduced by 211 m. There was a skew in number of transect meters surveyed per vegetation type and management type, and not all vegetation types occurred in all management types (Fig. 2) Abandoned Grazed Mown Surveyed vegetation Vegetation type Figure 2: Number of transect meters surveyed per vegetation type and management type. Vegetation type 10 and 11 were often found on the two edges of transects, partly explaining the skew. Moisture and ph Measurements of soil moisture and ph were done in mid August, during the two last days of a four-day period of dry weather. The dry conditions were needed to capture as wide a range of soil moisture values as possible. Due to the limited time span of dry, assumingly constant weather, not all transects could be sampled. One transect was randomly selected 15
20 from 16 of the 20 blocks. In one additional block, the valley at Sølendet, two transects were randomly selected for measurements because of the large block size. Pairs of moisture and ph measurements were sampled along the lines of each of the selected transects. Except in the valley block at Sølendet, moisture and ph measurements in the mown areas were done at the transect endpoints and every 25 m in between. In the mentioned valley and elsewhere in the study area, the slight U-shape in topography and the variability of the length of vegetation zones called for site-specific determination of distances between measurement points. One measurement point was placed at what was perceived to be the lowest, and thus wettest, point. In both directions from this, the distance from the lowest point to the woodland/scrubland edge was divided into two equally long lines, and measurements were done at the middle of these. In addition, one measurement point was put out beyond the grassland edge, in the woodland or scrubland. Thus for each of the valley transects there were 7 measurement points for ph and moisture. In total, 119 measurement points were sampled for both moisture and ph, distributed on the management types as follows: mown (36), grazed (41) and abandoned (42). Soil moisture was recorded in the field using SM150 Soil Moisture Sensor. This equipment is very sensitive to moisture, as moisture levels above 85%vol are displayed as too wet. Measurement accuracy is reduced at levels higher than 70%vol. This was one of the reasons for measuring under dry conditions. Soil ph was measured from soil samples cut ca. 5 cm downwards through the soil profile at the same spot as moisture measurement took place. This was done using a thin metal tube of ca. 1.5 cm in diameter, which was cleansed with deionized water between cuts. Soil samples were separated and stored in small plastic cups. In the evenings, collected samples were dissolved in 30 ml deionized water and measured with the ph meter HANNA HI Between each measurement the sensor was cleansed with deionized water. The ph meter was calibrated using ph 7.01 and ph 4.01 buffers in the mornings of measurement days. The ph and moisture measurements show gradients with vegetation type order (Figure 3 a, b). From the 119 measurement points, both moisture and ph show strongly significant decrease with increasing number for vegetation type. A linear model on exponential ph as response variable and vegetation type as numeric explanatory variable was chosen for ph (p < 0.05). For moisture a binomial-family generalized linear model on moisture proportions as response variable and vegetation as numeric explanatory variable was fit (p < 0.05). Models were made in R 3.0 (R Core 2013). For some of the further analyses, these relationships with vegetation type are therefore used to explain moisture and ph. There are quite few ph and moisture measurement points on the wet end of the gradient. This skew is due to the fact that fewer meters of the wetter vegetation types than the drier ones were included in transects. Also, the sampling procedure in the valley transects produced half as many samples from the wettest point as from any of the vegetation types on the slopes and edges. 16


 Alchemilla spp.")
21 a) b) Figure 3: Plots showing relationships of a) vegetation type and moisture and b) vegetation type and ph. Moisture and ph were for analyses incorporated in the vegetation variable. Table 3: Vegetation type characteristics. For moisture and ph, NA means that measurements were not taken. * Moisture measurements above 70%vol are uncertain. Type Vegetation Rich fen brook Rich fen lawn Damp Alchemillagrassland Sølendet veg. map 2c - 2j 3k, 4k Description Dominant species Other typical species Typical for the lowest lying parts of the valleys, where standing/running water is found during longer periods of the growing season. Different types. Most types characterized by high moisture level, litter/peat accumulation, predominant bottom and field layers. Graminoids dominate. Field layer usually <50 cm. Dominated by Alchemilla sp., leaves shading out many smaller herbs. Height of field layer about cm. Site specific Depending on fen community (not elaborated in this study) Alchemilla spp. Salix spp., tussocks of Carex spp., Caltha palustris, Alchemilla spp. Depending on fen community. Types which fell into transects were amongst others inhabited by Carex spp., Eriophorum spp., Pedicularis oederi, Filipendula ulmaria and Dactylorhiza incarnata ssp. cruenta. Geranium sylvaticum, Listera ovata, Polygonatum verticillatum, Angelica sylvestris Mean moisture %vol Mean ph 89.3* 6.3 NA NA 91.3*
22 Rich fen margin Damp tallherb grassland Tallherb grassland Dry Geraniumgrassland Open lowherb grassland Open, dry and poor heath Poor juniper heath Betula woodland Anthropogenous tallherb grassland 2k, 3k 3m 4m 4f-4k 4g Very dry 4a-4b 4au Intermediate or transition zone between fens and grasslands. Vegetation <50 cm in height. Typical vegetation of the transition zones between the wettest and the drier grassland vegetation of the valleys. Also in moist, shaded areas beneath forest canopies and/or on north-facing slopes. Salix shrubs occur. Different species composition from type 6. Height of field layer usually 0,4-1,5 m. Tall grasses and broadleaved herbs, often in dense stands. Shading out or limiting lower growing species. Typical of base rich floors of loose deciduous forest and grasslands undergoing succession. Height of field layer often 1-1,5 m. Shrubs occur, incl. Salix sp. Typical semi-natural grasslands. If trees and shrubs are present they are scattered. Species rich field layer with several different grasses and low-herbs. Field layer about cm in height. Somewhat drier, and lower and less densely vegetated than the "dry Geranium-grassland". These two types hold many of the same species, though in differing abundance. This type has less of the medium-tall herbs and more of the smaller ones. Open area with sandy and dry soils. If trees or shrubs are present they are scattered. The field layer is very sparse, scattered and low-grown. The bottom layer is also scattered, but covers a bit more than the field layer. Characterized by a dense shrub layer, 0,5-1,5 m in height. The field layer is sparse or absent. Bottom layer is often pronounced. Dense deciduous forest. Trees are most often taller than 5 m, and the canopy is closed. Shrubs and saplings are often present and numerous. Field and bottom layer is dominated by shade tolerant species. Field layer often 1 m or taller, dominated by species that compete well and grow fast on nutrient rich soils. At some sites, single species may form dense stands. No clear dominance of some few species; a fair mix Filipendula ulmaria, Geum rivale, Deschampsia cespitosa Aconitum septentrionale, Cicerbita alpina, Deschampsia cespitosa Geranium sylvaticum, Trollius europaeus, Ranunculus acris, Galium boreale Agrostis capillaris, Poa spp., Achillea millefolium, Euphrasia wettsteinii Lichens Juniperus communis, Salix spp., Betula pubescens Solidago virgaurea, Trientalis europaea, Vaccinium spp., Avenella flexuosa Site specific, as single species may form dense and homogenous stands. Succisa pratensis, Carex atrofusca, Parnassia palustris, Bartsia alpina, Pedicularis oederi, Bistorta vivipara, Molinia caerulea Filipendula ulmaria, Geum rivale, Deschampsia cespitosa, Alchemilla spp., Calamagrostis spp., Crepis paludosa, Angelica archangelica, Petasites frigidus Salix spp., Paris quadrifolia, Ranunculus platanifolius, Milium effusum Alchemilla spp., Saussurea alpina, Rhinanthus minor, Agrostis capillaris, Achillea millefolium, Omalotheca norvegica, Solidago virgaurea, Poa spp., Coeloglossum viride, Nigritella nigra Thalictrum alpinum, Campanula rotundifolia, Leontodon autumnalis, Bistorta vivipara, Erigeron acer, Botrychium spp., Gentiana nivalis, Gentianella spp., Nigritella nigra A few drought tolerant bryophytes, Vaccinium spp., Empetrum nigrum, Nardus stricta, Avenella flexuosa, Calluna vulgaris, Solidago virgaurea, Botrychium spp. 73.0* * Betula nana Viola spp., Melampyrum spp., Oxalis acetosella Urtica dioica, Chamerion angustifolium, Anthriscus sylvestris, Silene dioica, Deschampsia cespitosa NA NA 18
23 Main data analyses Detection probability Distance sampling is a widely used method for producing abundance and density estimates of biological populations. Distance 6.0 (Thomas et al. 2010) was used to model detection functions for the different species and for the species within the different management types, based on the perpendicular distance measurements for species observations. Corrected Akaike Information Criterion (AICc) was used for selection of detection functions. From the chosen functions, effective strip half-width estimates were attained. These were doubled to effective strip widths (ESW), because observations were made on both sides of the transect line. ESW is calculated as the width in meters where the number of individuals observed outside exactly equals the number of individuals missed within. In effect this gives the transect width at which individuals were detected. ESW estimates are in the present study used 1) for calculation of estimated transect area, which is used in illustrations on density and as offset in statistical models at transect level and 2) as estimated transect meter area, which is used as offset in models at transect meter level. An offset is a component of the predictor (here: density or occurrence probability) that is known in advance and therefore does not need a parameter to be estimated from the data (Crawley 2007). This is held constant while other explanatory variables (here: management and vegetation) are evaluated, and saves degrees of freedom. Detection functions fit by the Distance software provided reliable estimates for transect widths (ESW). Detection functions on distances for species across management types generally fit well. For species within management types most functions fit well (see Table 5 for ESW estimates and Appendix 1 for a detection function example). There were a few exceptions due to low numbers of observations (G. amarella in the abandoned area) or scattered distribution of distance values (N. nigra in all management types). ESWs on the species across management types were in these cases used in further analyses. Table 5: Number of observations (n) and estimated effective strip widths (in meters) stratified for species within management types (ESW sp/man). *ESW for species across management types used. Species Abandoned Mown Grazed n ESW sp / man n ESW sp / man n ESW sp / man Nigritella nigra * * * Gentianella campestris Gentianella amarella * Gentiana nivalis Botrychium boreale Botrychium lunaria Botrychium lanceolatum
24 Effects of management and vegetation Two types of models on two different scales were used to investigate the distribution and abundance of species as effects of management and vegetation. Data was recorded per single transect meter, thus analyses on this small scale is possible. However at this scale, the count data has too high a fraction of zero values to be handled by models using Poisson error distribution. Therefore, analyses on count data and estimations of density are scaled to the transect level (counts per species per vegetation type within each transect). Analyses at the transect meter level are performed on data where counts per meter are transformed to presence (1) or absence (0) per meter. This allows for use of binomial error structure in models and estimations of probability of occurrence for the species. Binomial distribution handles the zero inflation tendency better than Poisson distribution. All statistical models were run in R 3.0. Significance level was set to 5% in all analyses. Density Analyses on density within management types and vegetation types are performed at the transect level, approached by making models and plots for each species. In R, generalized linear models (glm) were fit to test whether management type or vegetation type had statistically significant effects on species densities. Models for each species were fit using count as response variable and management type and vegetation type as explanatory factor variables. The moisture and ph gradients shown for vegetation types (Fig. 3) would indicate fit of vegetation type as a continuous variable. This was attempted, though as individuals of the species most often were found in relatively few combinations of management type and vegetation type, models on density could not be fit by R when using vegetation type as continuous. Five candidate models with different combinations of explanatory factor variables were fit per species; intercept only, management type only, vegetation type only, management and vegetation as additive effects, and finally management and vegetation with interaction. Estimated transect area was used as offset in all of the models. The data was assumed Poisson-distributed, and Poisson-family log link models were fit. These were checked for overdispersion, and all candidate models for a species were re-fit as negative binomial if overdispersion was detected in the Poisson-family models. Model selection was done by using Akaike Information Criterion (AIC). In Excel, the density per vegetation type per transect was calculated by dividing the count per vegetation type by the estimated area of vegetation type (number of meters of vegetation type * ESWsp/man). Thus these density estimates do, as the glm models, account for differences in the distribution of transect meters between vegetation types and for differences among species and management types in detection probability. Average estimated density per meter with standard errors was further calculated per management type and vegetation type. Another analysis was done for all species in total, of density within management types only (across vegetation types). Detection probability was accounted for 20
25 in this analysis, though the distribution of vegetation types on transects was not. Student t- tests were fit to check whether there were significant differences in density of study species among management types. Plots were made per species on their estimated density within vegetation types and management types, and one plot was made for the analysis on density within management types, across species and vegetation types. For convenience, the density estimates per meter are scaled up to per dekar (one dekar equals 1000 m 2 ) in the plots. The plots illustrate the level on which density was tested in models, and the models are testing the significance of what is illustrated in the plots. In the models though, the data was assumed Poisson-distributed, and model results may therefore deviate from the plot illustrations. Probability of occurrence Analyses on occurrence within management types and vegetation types were performed on presence/absence (1/0) data at the transect meter level. Binomial-family logit link generalized linear mixed models (glmm) were fit to this level. Management and vegetation were fit as fixed factors, while transect and block were fit as random factors in all models. This was done because management and vegetation are those factors of which the effects on the mean probability of occurrence were interesting to estimate. The random factors were fit because it was important to account for the possible variance due to effects of transects or the non-independence of transects within blocks. Vegetation type was treated as continuous, as vegetation type reflects a continuous process from wet to dry (Fig. 3). With 0,1 data and binomial family this did not cause the modeling issues met in the glms. Thereby it was also possible to test for the expected peak in occurrence probability in intermediate vegetation types (low-grown grasslands), by applying vegetation type as a quadratic term, veg 2. Mixed models account for the hierarchical design in this study, and for the fact that the number of surveyed transect meters differed between management and vegetation types. Six candidate models with different combinations of fixed effects were fit per species; intercept only, management type only, continuous vegetation type only, veg 2, management and vegetation as additive effects, and finally management and vegetation with interaction. If interaction between management and quadratic vegetation type would appear significant, this would indicate that the particular species occur at different habitat ranges among the differently managed areas. Model selection was done by using AIC. Selected mixed models are illustrated in two ways. Firstly, plots on probability of occurrence per management type and vegetation type were made in R from back-transformed coefficients. Secondly, maps on predicted distribution within the study area were made in ArcGIS, by creating raster formats of the management and vegetation variables, on which back-transformed coefficients were extrapolated using the Raster calculator. Different types of illustrations can be made for different purposes. In this case, plots are made because they show clearly the results of complicated models, and are quite easily interpreted. Maps are made as a way of showing how results can be useful as applied for e.g. management purposes and reserve design. Map making first required digitalization of the 21

26 Density (# ind pr dekar) vegetation map for Sølendet in ArcGIS. Further, this needed to be combined with the vegetation map for the grazed and abandoned areas, and the vegetation types used for the present study. This was a challenge, due to the generality of the vegetation map for the grazed and abandoned areas, which had fewer and wider vegetation types. Because of this, vegetation types from the Sølendet map and the field survey were grouped to fit the most general map, which involved loss of considerable amounts of information. Presented maps represent a methodological example and potential occurrence predictions. Results 1423 observations were recorded altogether on study species. Per species, a total of 152 individuals were observed of N. nigra, 468 of G. amarella, 195 of G. campestris, 100 of G. nivalis, 193 of B. boreale, 288 of B. lunaria and 27 of B. lanceolatum. Number of observations per species and management type is found in Table 5 in the methods. About 2 % of the individuals observed are known to have been assigned the wrong vegetation type, due to reduced GPS accuracy when recording the location of individuals or borders between vegetation type intervals. Distance from the transect line to observed individual was always shorter than half the distance between transect lines, thus transects never overlapped. Density When looking at effects of management type across species, transects and vegetation types, the total density of all study species seems higher in both grazed and mown areas than in abandoned areas (Fig. 4). Two-way t-tests show that the density is significantly higher in grazed areas than in abandoned (p < 0.05). No significant differences were found between abandoned and mown areas or between grazed and mown areas (both p > 0.05) All study species Abandoned Grazed Mown Management type Model results on density indicate effects of vegetation type and management type for some species, though not for all. Candidate and chosen Figure 4: Density of study species within management types. Standard error bars represent among-transect variation. generalized linear models are shown in Table 6, and details on selected models are found in Appendix 2. Effects of mowing and grazing are in the analyses compared to those of abandonment, except for G. nivalis, which was not found in the abandoned area. Effects of vegetation types are compared to those of the wettest type in which individuals were observed for each species, referred to as intercept/reference. Models give density estimates as the mean number of individuals per transect meter within management types and 22
27 vegetation types. Figure 5 shows density estimates for selected species, distributed between the categories of management and vegetation. G. nivalis was the only species for which the selected model has interaction effects of vegetation and management on density (Fig. 5a). This species was found in mown and grazed areas and in vegetation types 7 and 8. Effects from the two management types and the two vegetation types were not significantly different (both p > 0.05). However there is a significant interaction effect of mowing and vegetation type 8 (p < 0.05), and density is estimated to be 9.7 in vegetation type 8 in mown areas. In chosen models for N. nigra, G. amarella, B. lunaria and B. lanceolatum both vegetation type and management type were included as additive effects on density. For N. nigra, effects of grazing and mowing are not found significantly different from abandonment (p > 0.05), although densities in general are estimated to be lower in abandoned areas, intermediate in mown areas and higher in grazed areas. Effects of vegetation types are compared to type 4, in which density is estimated to 0.01 in abandoned areas, 0.61 in mown and 1.15 in grazed areas. Effects on density were significantly different from type 4 for types 8, 10 and 11 (all p < 0.05). Within all management types, density estimates are highest in vegetation type 8 (abandoned: 6.13, mown: 6.73, grazed: 7.26). In types 10 and 11, density is estimated to lower than 0.2 in abandoned areas, lower than 0.8 in mown and lower than 1.3 in grazed ones. Fig. 5b illustrates the significantly higher density in vegetation type 8, however the apparently high density in vegetation type 7 is not found significantly higher than in type 4 in the model (p > 0.05). For G. amarella and B. lunaria, models fit with Poisson-family show overdispersion and are re-fit as negative binomial models. For G. amarella the density is found to be significantly higher in mown areas than in abandoned areas (p < 0.05). Its density is estimated to be lowest in abandoned areas, intermediate in grazed and highest in mown areas. No significant effects are found for any of the vegetation types (p > 0.05), though density is estimated highest in type 8 and 7 in all management types. For G. amarella the significantly higher density in mown areas is illustrated in Fig. 5c. In the chosen model for B. lunaria, no management types are found significantly different form abandonment, and no vegetation types are found significantly different from type 3 (p > 0.05), which is the reference factor level for the vegetation types. B. lanceolatum was observed only in grazed and abandoned areas and in vegetation types 7, 8 and 11. Grazing and abandonment do not seem to differ in effects on density, and vegetation types 8 and 11 do not have significantly different effects from type 7 (p > 0.05). Vegetation type is the only variable included to explain variation in density for G. campestris and B. boreale. In the chosen model for G. campestris the density in type 7 is significantly higher than in type 4 (p < 0.05), estimated to 0.46 and 0.08 respectively. Estimated densities are also found significantly higher in vegetation types 9, 10 and 11 (all p < 0.05), in which the estimated densities range between 0.11 and The density peak in vegetation type 7 is shown in Fig. 5d. The density was however by the model estimated highest in type 8, as is also conspicuously indicated in the figure. This was not found significant in the model (p > 23
, which is the intercept type for B. boreale. Estimated densities within these vegetation types are 0.")
, which possibly has a similar reason to that suggested for G. campestris. a) 50 45 40 35 30 25 20 15 10 5 0 Gentiana nivalis 1 2 3 4 5 6 7 8 9 10 11 12 Vegetation type Grazed Mown b) 4.0 3.5 3.0 2.5 2.0 1.5 1.0 0.")
28 Density (# ind pr dekar) Density (# ind pr dekar) 0.05), possibly because the density was not higher in type 8 than in type 4 in all management types. For B. boreale, only type 11 is found to have significantly higher density than type 5 (p < 0.05), which is the intercept type for B. boreale. Estimated densities within these vegetation types are 0.31 and 0.03, respectively. The estimated density from the model was highest in type 8, though this was not significant in the model (p > 0.05), which possibly has a similar reason to that suggested for G. campestris. a) Gentiana nivalis Vegetation type Grazed Mown b) Nigritella nigra Vegetation type Abandoned Grazed Mown 24

. Note that scale limits of the y axes are different, adapted to best depict densities for each species.")

29 Density (# ind pr dekar) Density (# ind pr dekar) c) Gentianella amarella Abandoned Grazed Mown d) Vegetation type Gentianella campestris Vegetation type Abandoned Grazed Mown Figure 5, a-d: Estimated density per species within management types (as bars of different colors) and vegetation types, for species of which management or vegetation had significant effect. Standard error bars show among-transect variation. Density estimates per meter are scaled up to per dekar (1000 m 2 ). Note that scale limits of the y axes are different, adapted to best depict densities for each species. Also recall that vegetation type 12 is excluded from statistical models, though included here to show that species are absent in this type. Probability of occurrence Transect meter level analyses on presence-absence indicate that management type and vegetation type differ in importance also to where species occur. Candidate and chosen generalized mixed models are shown in Table 7, and details on selected models are found in Appendix 3. Also here, mowing and grazing effects were, except for G. nivalis, compared to abandonment effects in analyses of management. Models give probability of occurrence between 0 and 1 per meter of vegetation types within management types. Estimates from 25
30 the total model for all species are given as % occurrence probability per meter. Because the estimates per species often are very low numbers, they are presented as scaled up to % probability of finding an individual per km 2 for N. nigra, and to % probability per dekar for all other species. For all study species in total, both management type and vegetation type with interaction effects were included in the chosen model. There are significant effects of quadratic vegetation type and interaction between quadratic vegetation type and grazing (both p < 0.05). The probability of occurrence is significantly higher in the grazed areas than in the mown and abandoned in all vegetation types from 6 to 11 (Fig. 6a). In all management types, the probability peaks in vegetation type 7, estimated to 15.7 % in grazed areas, 10.5 % in mown and 10.1 % in abandoned. The probability of finding any of the species is higher than 5 % in vegetation types 6-9 in the grazed areas and in vegetation types 6-8 in the mown and abandoned areas. Also for G. campestris and B. lanceolatum, both management type and vegetation type with interaction effects were included in chosen models. For G. campestris there was significant effect only of quadratic vegetation type (p < 0.05). The probability of occurrence peaks in type 5 in mown areas, type 7 in grazed areas and in type 6 in abandoned areas. In types 5 and 6, the probability of occurrence is significantly higher in the mown areas than in both the grazed and abandoned areas (Fig. 6b), though overall effects of management were not found of significantly different in the model (p > 0.05). In type 5 and 6 the probability of occurrence is estimated to respectively 3.9 % and 3.2 % in mown and 0.1 % and 0.2 % in both grazed and abandoned areas. This indicates that G. campestris occurs more frequently in mown areas, at least in damp grassland types, whereas in mown and abandoned areas it occurs less frequently, and in drier grassland types. For B. lanceolatum no effects of either management or vegetation turned out significantly different (p > 0.05). Management type and quadratic vegetation type were both included as additive effects in the selected model for G. amarella, though effects of mowing and grazing were not significantly different from the effect of abandonment in this model. Quadratic vegetation type had strongly significant effect on probability of occurrence for this species (p < 0.05), indicating that its occurrence frequency peaks in low-grown grassland vegetation. In all management types, the probability per dekar peaks in vegetation type 7, closely followed by type 8, estimated to respectively 11.9 % and 10.8 % in mown areas, 3.6 % and 3.3 % in grazed and 0.9 % and 0.8 % in abandoned areas. G. amarella seems to occur in similar habitat range in all management types (Fig. 6c). For N. nigra, B. boreale and B. lunaria, the quadratic vegetation type variable shows strongly significant effect on the probability of occurrence (p < 0.05), indicating peaking probability of occurrence in vegetation types 7 followed by 8 (low-grown grasslands). Management is not included in their chosen models. The estimated probability of occurrence for N. nigra peaks at % per km 2 in vegetation type 7. Estimated probability of finding an individual of 26


31 this species is higher than % per km 2 for vegetation types 5 to 9. The probability of finding an individual of B. boreale is estimated to 40.6 % per dekar in vegetation type 7, closely followed by 37.5 % per dekar in type 8. For B. lunaria the occurrence probability is estimated to 53.9 % per dekar in vegetation type 7 and 44.3 % per dekar in type 8. For both these two species, the estimated chance of finding an individual is higher than 15 % per dekar for all vegetation types from 6 to 9. N. nigra, B. boreale and B. lunaria are thus all predicted to occur most frequently in vegetation type 7. Also for G. nivalis, quadratic vegetation type was the explanatory variable in the chosen model, though its effect was not significant (p > 0.05). a) 27
 G. campestris and c) G. amarella. Recall that vegetation type 1 is the wettest, and type 11 the driest. The low-grown grasslands are types 7 and 8.")

32 b) c) Figure 6: Plots on probability of occurrence within management types and vegetation types for models on presence/absence of a) all study species in total, b) G. campestris and c) G. amarella. Recall that vegetation type 1 is the wettest, and type 11 the driest. The low-grown grasslands are types 7 and 8. Estimated occurrence probability per meter is for convenience scaled up to per dekar. Solid lines represent estimated mean occurrence probabilities, while dashed lines show 95% confidence intervals. Note the slightly different scale limits of the y-axes for the three different plots, adapted to best depict the curves. 28
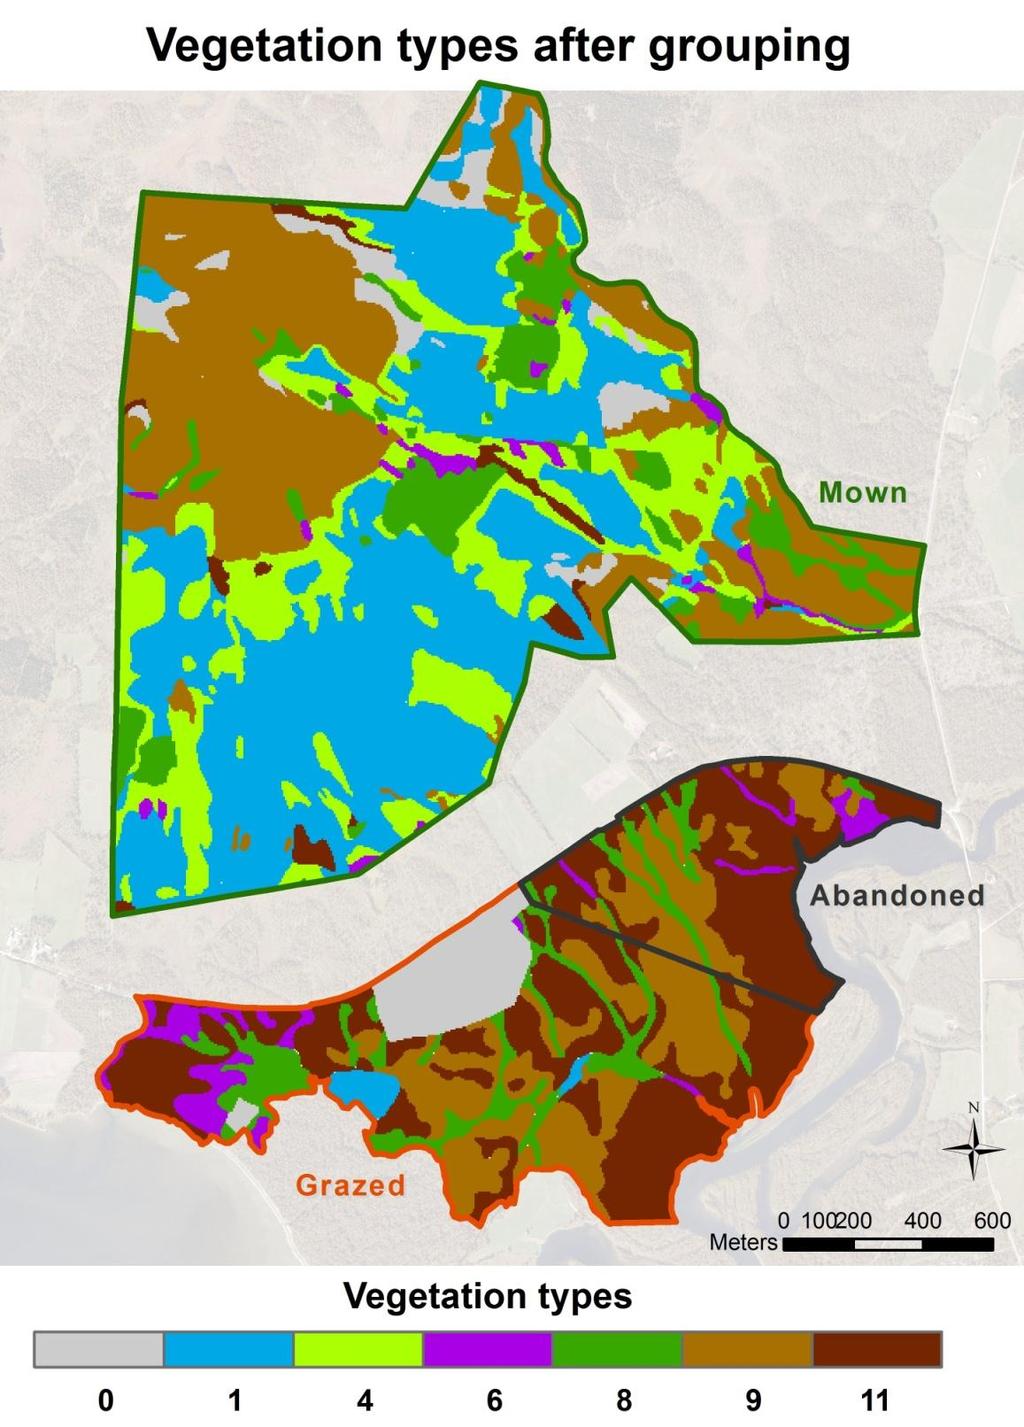
33 The vegetation grouping used in the model extrapolation onto maps is shown in Table 4, and a map of the grouped vegetation types within the management type areas is shown in Fig. 7a. Maps on predicted distribution are shown in Fig. 7b for all study species in total (percent probability of occurrence per meter) and in Fig. 7c for G. amarella (scaled up to percent probability of occurrence per dekar). The maps show the estimated probability of occurrence in the vegetation types which were applied to the maps, for each of the management type areas. The predicted occurrence probabilities are generally shown to be higher in managed areas and in the low-grown grassland vegetation (type 8) followed by heathlands (type 9). There are some implications of the maps, which are further treated in the discussion. The maps illustrate the potential occurrence probabilities if the conditions assumed in the map making were the prevailing conditions. Table 4: The grouping of vegetation types, further used in map making. Vegetation types which were present within the study area but did not occur in transects or models (NA) are assigned type 0 in the map making. Recorded types NA 1, 2 3, 4, 5 6 7, 8 9, Types applied to maps No Dry Dry lowgrown Short description of Wet Damp Heath and Deciduous predicted tallherb types applied to maps types grassland scrubland woodland distribution grassland grassland 29

34 a) b) 30
35 c) Figure 7: a) Map of the vegetation types, or the raster, onto which models for probability of occurrence were extrapolated. Note that the abundance of vegetation type 11 (woodland) in Sølendet nature reserve ( Mown ) is severely underestimated. Maps of predicted, potential distribution within the study area are shown in b) for all species (% probability of occurrence pr meter) and in c) for G. amarella (scaled up to % probability of occurrence pr dekar). Darker colour indicates higher occurrence probability. 31
36 Table 6: Candidate generalized linear models (glm) for transect level analyses on density. Chosen models are shown in bold. The response variable was count for per species models, and presence/absence (1/0) for the all species model. Transect area (ESW*transect length) was used as offset in all models. Explanatory variables N. nigra G. amarella G. campestris G. nivalis B. boreale B. lunaria B. lanceolatum AIC ΔAIC AIC ΔAIC AIC ΔAIC AIC ΔAIC AIC ΔAIC AIC ΔAIC AIC ΔAIC ~ ~ man ~ veg ~ man + veg ~ man * veg Table 7: Candidate mixed effects models (glmm) for transect meter level analyses on occurrence probability. Chosen models are shown in bold. For all models the response variable was presence/absence (1/0), random effects were transect and block, and transect meter area (ESW) was used as offset. Fixed effects N. nigra G. amarella G. campestris G. nivalis B. boreale B. lunaria B. lanceolatum ALL SPECIES AIC ΔAIC AIC ΔAIC AIC ΔAIC AIC ΔAIC AIC ΔAIC AIC ΔAIC AIC ΔAIC AIC ΔAIC ~ ~ man ~ veg ~ veg 2 + veg ~ man + veg 2 + veg ~ man * veg 2 + veg
37 Discussion Main results The main intention of this study was to identify effects of management on the distribution and abundance of rare low-herb species, while controlling for important ecological factors. This study shows that both the density of, and the probability of finding, individuals of any of the studied species is higher in grazed areas than in abandoned areas. However the responses to management are in this study shown to differ among species, as especially the gentians seem to show preferences to mown areas. Moisture and ph levels were correlated with vegetation types, and the low-grown grassland types (type 7 and 8) experienced intermediate moisture levels and relatively high ph. For three of the seven studied species, density was shown to be positively related to such grassland vegetation, and for five of the species, the probability of their occurrence was shown to be highest in these vegetation types. The hypotheses outlined in advance are supported, as some preferences were found for most species regarding management type or vegetation type (including moisture and ph). All species except B. lanceolatum show either higher density or higher probability of occurrence (or both) as response to active management or the presence of low-grown grasslands (or both). The results from the analyses of density and probability of occurrence are not really comparable. This is due to the many differences between the statistical approaches used, which are elaborated in the methods. Therefore, such comparisons are not attempted. Management and vegetation Vegetation type, notably the presence of low-grown grasslands (type 7 and 8), was more often a determinant of the distribution and density of the study species than management regime. This is likely to be explained by the fact that these habitats in upland areas such as Brekken were created by the traditional land use practices, and the remaining are sustained by management (Eriksson et al. 2002, Moen and Øien 2012). Thus the preferred vegetation types for the low-herb species are products of active management, and the effects of mowing and grazing are very likely to be masked within the clearer effects of vegetation. As management is an important driver of shifts between vegetation types, it may be difficult to segregate effects of management from effects of the properties of vegetation types in comparative studies like this one. Joint effects of management and environmental variables have been found in previous studies on semi-natural grasslands (Barbaro et al. 2004, Klimek et al. 2006). However, long-term studies at Sølendet have shown how abandonment leads to a shift towards tall-herb grasslands, scrubland and woodland, and how this process can be reversed back towards low-herb grasslands through active management (Moen and Øien 2012). 33
38 Effects of management on the environment and vegetation Managed grasslands have many similar characteristics, as they are open and inhabited by low-grown grasses and herbs. The impacts of mowing and grazing provide favorable ecological conditions for taxa which have certain traits and life histories. These need to be adapted to mowing or grazing in one or more of these three ways: surviving and regenerating from plant part loss, having sufficient production of new individuals or being inedible. In Grimes C-S-R-model, this is transferrable to short-lived and rapidly reproducing plants such as the ruderals, and stress-tolerant ruderals of more long-lived species (Grime 2001). Basal position of meristems and buds or belowground position of perennating organs, found in Raunkiaers hemicryptophytes and cryptophytes, is advantageous in these habitats (Gurevitch et al. 2006). So is basal position of leaves, forming rosettes or hemi-rosettes (Prévosto et al. 2011). Vegetative reproduction through rhizomes or stolons is another way of omitting the disturbances posed to the field layer (Øien and Moen 2006). Though there are some general trends in grasslands, mowing and grazing have different effects on plants and the environment, which in turn may affect the distribution and abundance of species or species groups differently (Norderhaug et al. 1999). In a mowing field, disturbance is evenly distributed; all plants are cut at the same level, and similar amounts of nutrients (aboveground plant parts) are removed across the site. Trampling effects come mainly from humans and modern mowing equipment, which has less impact on soil conditions than the heavier grazing animals. This may make it easier for trampling sensitive species to live in mown sites than in grazed ones (Lennartsson and Oostermeijer 2001). Mowing may promote low-herb species which are especially palatable to grazers (Ekstam and Forshed 1997), or species which grow and flower either before or after mowing incidents, or can live with some apical damage (Huhta et al. 2003). The effects of mowing depend on the frequency and timing of execution. Grazed areas are posed to more scattered distributions of disturbances (Norderhaug et al. 1999). Both nutrient removal (aboveground plant parts) and input (manure) is patchy. Some grazer species show food plant preferences and aversions, which may alter abundance and competitive relationships among species. Grazing pastures may therefore become dominated by grazing tolerant taxa. Trampling effects are also patchily distributed. Trampling from cattle often has large effects through soil compaction and displacement, and creation of spots of bare soil. This may promote species which depend on such spots for germination, while reducing trampling-sensitive taxa. Effects depend on grazing animal species and density, and timing, duration and frequency of grazing, and the resulting animalplant and plant-plant interactions (Medina-Roldan et al. 2012). Thus, effects and conditions are often more complicated in grazed areas than in mown areas. The methods used in current management practices deviate somewhat from the traditional land use practices, which may also have impact on species distribution. In the traditional 34
39 land use, mowing was performed with a scythe, whereas nowadays managers most often use motorized mowing equipment. Goats and lighter cattle types were formerly more common livestock in grazing pastures. Grazing is currently mostly applied with sheep and heavier cattle types, often at much higher densities than in the former land use, which increases trampling, grazing pressure and nutrient input in sites. Generally in the traditional land use, mowing with subsequent grazing by animals at low density was a common approach, which posed the vegetation and environment to combined effects of mowing and grazing. This was probably not the case in the study area (landowners personally informed). Where this was common though, it has in practice been abandoned for several decades, and is not very likely to reappear as a management strategy. This approach may have supported a great variety of low-herb species, as mid-summer mowing would keep the vegetation lowgrown and suppress the competition level, whereas a low grazing pressure in the autumn could provide spatial gaps for species which require that for seed germination (Barbaro et al. 2004). In the study area, mowing is performed in fens and grasslands with a two-wheeled tractor, and the hay is gathered and mostly burned. Grazing is by the most common cattle type, Norwegian Red, at quite low density. About 20 animals spend the summer within the total grazing area, which is about 0.7 km 2 in size. At low densities like this, grazers are shown to prefer the most productive habitats for foraging (Mobæk et al. 2009). Thereby indicated, the fens and grasslands are those vegetation types which can be considered managed within the study area. In this study, it might therefore be dubious to differentiate species responses in management types for heathlands, scrubland and woodland. The abandoned area used for this study has still got low-grown grassland vegetation present within it (Fig. 2), in which individuals of the study species were found. Shrubs have started colonizing theses grasslands, although their cover was not measured. The most probable reasons why this area has not totally grown back are the short growing season and the soil conditions and overall vegetation of the area. As can be seen from figure 2, there is a higher proportion of heathland and scrubland in the abandoned area than in the grazed and mown ones. With these vegetation types surrounding the grassland valleys, it is likely that the colonization process of the grasslands has been slowed down. Species turnover is suggested to be lower in heathlands than in grasslands (Chytry et al. 2009). The dry and relatively stable heathlands may therefore have served as a buffer zone at the edges of grasslands, and slowed down colonization by tall herbs, shrubs and trees, as source populations of such species have been kept more distant in space. However the abandoned area has surely to a great extent been encroached by shrubs and trees the past decades, as is obvious when new and old aerial photos are compared. It is likely that the abandoned grasslands are going to be overgrown in the course of the next few decades. 35
40 Species responses Totaled The total density of all studied species is significantly higher in grazed areas than in abandoned areas (Fig. 4). It also appears higher in mown areas than in the abandoned, though this was not found to be significant. This is probably due to the high standard error of species counts especially in the mown areas, which is believed to originate from the species being rare, and that individuals of some species were found to be locally clustered in distribution. If clustering is part of the source of the particularly large standard errors in the mown area, and if clustering had been accounted for, one might have found significantly higher density and revealed larger population sizes in mown areas. The probability of finding any of the studied species is highest in low-grown grassland vegetation types, especially where there is an interaction effect of these and grazing. The occurrence probability peaks in low-grown grasslands in all management types, and further the habitat range is expanded at the drier and poorer part of the vegetation gradient in grazed areas compared to mown and abandoned areas (Fig. 6a). Thus the study species in total are predicted to occur in a wider range of habitats in the grazed areas compared to the mown and abandoned ones, especially in the drier types, as the difference is significant for more vegetation types at the drier side of the peak. Because the total model used for this analysis assumes that all the summarized species are a uniform group, its results are less precise than the ones from the per species models. Results may well have turned out different if data on other species than the chosen ones were lying at base. This is also the case with the above described total density analysis. For the chosen species though, conservation of as many of them as possible, in as broad a habitat range as possible, seems best obtained by low-intensity grazing. Studies have pointed to the effects grazing have on plant diversity by creating environmental heterogeneity, particularly at the soil gap scale (Adler et al. 2001). This may promote species diversity through enhancing seed establishment for species in which this is a critical phase. However, models for each species revealed positive effects of mowing on several species. Therefore both grazing and mowing are important management strategies in conservation of rare low-herb species. There are several studies on the effects and the conservation potential of grazing and mowing. For instance, Hansson and Fogelfors (2000) found that both grazing and mowing were appropriate tools for maintaining a low-grown community structure, but mowing was to prefer if the aim was preservation of high species richness. Fischer and Wipf (2002) and Maurer et al. (2006) found that mown grasslands had higher species diversity than grazed ones, when both were unfertilized. Moreover, continuity of whatever management approach has been shown to be of overriding importance to species diversity (Aavik et al. 2009). Therefore, local land use history is essential for successful management design. 36
41 Gentians Results from the species models indicate that gentians thrive best in mown areas. G. nivalis is at highest density in low-grown grasslands in mown areas, G. amarella is at highest densities in mown areas, and G. campestris is found at highest density in the low-grown grassland vegetation. The probability of finding G. amarella is highest in low-grown grasslands. For G. campestris this probability is highest in mown areas, significantly so in damp grasslands. This mowing management preference is for G. campestris confirmed in a study by Lennartsson and Oostermeijer (2001). In this study it was shown that individuals grew larger and produced more seeds in mown sites than in grazed ones, and also that the timing of mowing is important, as adult growth in the summer was impaired by tall surrounding vegetation when mowing was done in the autumn. Late mowing was nevertheless more beneficial than grazing. Thus G. campestris seems to prefer mid-summer mowing as management type. However generalizations regarding management type and timing should be treated with care in site specific management, as responses following a particular form of disturbance may vary notably between populations, between years, and relative to the timing of clipping in relation to flowering phenology (Lennartsson et al. 1998). Kelly (1989) showed that a low turf height was positively correlated with survival and fecundity of G. amarella. Huhta et al. (2003) found that this species tolerates a low level of apical damage by compensatory or over-compensatory growth. G. nivalis has previously been shown to increase following both restorative mowing (Moen and Øien 2012) and grazing (Geddes and Miller 2010). G. nivalis is a relatively small species, and therefore may have quite high requirements for light availability at the ground level to germinate and grow (Miller et al. 1999). There were some modeling problems for this species in the analysis of occurrence probability. This may have been a consequence of G. nivalis having a narrow ecological niche, which is supported by that records of it were made in few vegetation types and management types. The few habitat combinations for the statistical program to analyze might have caused difficulties in finding differences. No studies were found on whether G. amarella and G. nivalis prefer one of mowing or grazing over the other. However the results of this study and that of Lennartsson and Oostermeijer (2001), along with the similarity between G. campestris, G. amarella and G. nivalis in life history and growth form, suggest that targeted conservation toward gentians seems best fulfilled trough mowing of seminatural grasslands. Hardly any individuals of the gentian species were found in the abandoned area. These small-sized and short-lived (annual or biennial) species may be responding more rapidly to abandonment than the long-lived ones (Pykälä et al. 2005). If dispersal into habitat is limiting for the distribution of low-herb species, then they are likely to disappear if encroaching tall species act as dispersal barriers. Seed colonizers are shown to be more likely to become locally extinct through a successional sequence (Vandvik 2004). This could be the case for the gentians, along with the fact that they have quite short-lived seed banks (Lennartsson and Oostermeijer 2001). 37
42 Nigritella nigra N. nigra is found at highest density in the low-grown grassland vegetation (types 7 and 8, see fig. 5b), and the probability of finding individuals of this species is also found to peak in these types. Due to this habitat preference, and because N. nigra ssp. nigra is endemic to, and endangered within Norway and Sweden (Gärdenfors 2010, Kålås et al. 2010), it is important to prevent its habitat and populations from disappearing. Quite a few individuals of N. nigra were found in the remaining grasslands in the abandoned area. This was not a big surprise, as this area is believed to include some of its primary localities in the Brekken region (Moen and Øien 2002), and is not yet totally overgrown. Alive individuals of long-lived species such as this one may have established decades ago, prior to, or in the starting phase of, successional processes in their surrounding environment. These individuals may persist for quite some time, even if their habitat becomes suboptimal (Lindborg and Eriksson 2004). This may explain the lack of apparent management effects on the distribution and abundance of N. nigra. In previous studies from Norway and Sweden, positive effects of both grazing and mowing have been indicated for N. nigra, while the number of flowering individuals have been shown to decline sharply in time series for overgrowing habitats (Björkback and Lundqvist 1997, Moen and Øien 2002). If grazing is applied as management strategy in conservation of rare orchid species such as N. nigra, the timing of grazing and choice of grazing animal species may be important, as some species graze heavily upon orchids (Barbaro et al. 2004). Botrychium The densities of the studied Botrychium species were largely not found significantly affected by management or vegetation. The probabilities of finding individuals of B. boreale and B. lunaria are across management types found to be highest in intermediate vegetation types, peaking in the low-grown grassland types. Considerable parts of the detected individuals of Botrychium species were found within the heathlands of the abandoned area. This confirms that these have slightly lower demands to base content and moisture compared to the other study species (Norderhaug 1988, Elven et al. 2013). Along with the points that there is still some grassland and heathland vegetation in the abandoned area and that Botrychium species are relatively long-lived and persistent, this may explain the lack of apparent management effects. However, the finding that B. boreale and B. lunaria are most likely to occur within semi-natural grasslands is supported in several publications (Nordhagen 1943, Moen 1990, Ekstam and Forshed 1997, Norderhaug et al. 1999). Otherwise there is little scientific research available on the ecology of these two Botrychium species. It would be very interesting to see more studies relating their ecological requirements to historic and current distribution patterns as well as former land use and current management. The lack of significant effects from management or vegetation on the distribution and abundance of B. lanceolatum may be due to the relatively low sample size both across, and distributed on, 38
43 management types and vegetation types. Several individuals were observed outside transects in the mown areas, but none were recorded within transects. This indicates that transect placement may have had considerable impact on the sampling for this rare species. Qualities and drawbacks of the methods used There could be other possibly important factors to the distribution and abundance of lowherb species in the study area, which were not measured. For instance, species may not fill their ecological niche within the area, due to dispersal limitation, the critical establishment phase or chance events (Vandvik 2004). The fact that the studied species are rare may have led them into situations related to rarity, like e.g. reduced populations from environmental or demographic stochasticity (Munzbergova 2006) or reduced fitness from inbreeding (Sletvold et al. 2012). Local or microclimatological conditions like topography, orientation, snow cover and solar radiation (e.g.bennie et al. 2006), and the nitrogen and phosphorous contents in the soil (Lorenzo et al. 2006) have also been shown to impact plant growth and diversity. Environmental factors are often correlated, and the challenge is to identify the most important ones. Based on previous studies, moisture and ph were chosen for this study, as they are pointed to as the most important factors to local distribution patterns in the study area. Equipment error may have led to inaccurate records of geographic position and measurements of ph and moisture. The minimum error of the GPS unit used is 4 m, which is relatively wide for a study on such a small spatial scale. Factors like weather, satellite positions, calibration, waiting time for the GPS to follow field worker movements, and surrounding environment (canopy etc.) may additionally have influenced the accuracy. Use of the GPS was though the best available method for recording position. As only about 2 % of the observed individuals are identified as misplaced into vegetation types, this low error is assumed not to influence the accuracy of the results to considerable extent. Correction of positions post field survey would have been biased and was therefore avoided. Generally, the equipment used is very up to date, and is assumed to have provided reliable results within the accuracy ranges given by the producers. The approaches for the data analyses in this study may have influenced the accuracy of the results. Detection probability for a first, is most likely dependent on the vegetation types where observations are made. There were however too few observations per species within the different vegetation types and management types to make detection functions and extract ESW estimates at his stratification level. Secondly, in the density analyses, transects are assumed to be independent. This is unlikely to be the case, as some of them are close and appear similar in vegetation pattern, or are affected e.g. by the same base rich water brook. Therefore, the results from the analyses on probability of occurrence are likely to be more reliable, as effects of transects and transect groups (blocks) here were accounted for. Generalized linear mixed models are also the best tool for analyzing non-normal data that 39

44 involve random effects (Bolker et al. 2009), such as that of this study. Thirdly, in model selection, there were several models for which ΔAIC from the chosen model was lower than 2, meaning that they were close to the chosen model in goodness of fit. Model selection could have been done in several other ways, e.g. by weighting AIC or performing likelihood ratio test. However these different approaches often end up with similar outcomes. AIC is a practical and widely used method (Crawley 2007), and was therefore chosen and used consistently in this study. There was limited time and suitable area for this study, and further studies would be interesting to elucidate among-year and among-region variation in species densities and occurrence related to management and ecological conditions. The abundance of (at least emerged) individuals varies among years for all of the study species, especially the annual or biennial gentians (Miller et al. 1999, Moen and Øien 2012). It would also be interesting to see the outcome of such a study where vegetative, non-flowering stages of N. nigra, G. amarella and G. campestris were included. If all plant life stages were included, the sample size would be larger and it might have been possible to see more significant effects of management and vegetation on these rare species. Prediction maps The prediction maps in Fig. 7 illustrate how model results can become useful to practical conservation purposes. The assumed distribution of vegetation types and management regimes in the map making differ from the prevailing on the following points: 1) The grouping of the recorded vegetation types found in Table 4 led to some loss of information on the distribution of occurrence probability for species, and the maps therefore do not reflect the full range of estimated probabilities found for each vegetation type in models. The vegetation types were grouped together with neighboring Figure 8: Not all sites within Sølendet nature reserve are mown. Sites which are regularly mown are shown in light green. types in the moisture and ph gradients, and the probability of occurrence did for most species show a unimodal peak in intermediate vegetation types. Therefore, if the base vegetation map was more detailed in the sense that vegetation types had similar subdivisions to the recorded types, the resulting maps would be expected to show more transition zones of occurrence probability between the presented high- and low-probability types. These grouping effects are assumed minimal for the predictions in the abandoned and 40
Slope-Intercept Formula
 LESSON 7 Slope Intercept Formula LESSON 7 Slope-Intercept Formula Here are two new words that describe lines slope and intercept. The slope is given by m (a mountain has slope and starts with m), and intercept
Unit Relational Algebra 1 1. Relational Algebra 1. Unit 3.3
 Relational Algebra 1 Unit 3.3 Unit 3.3 - Relational Algebra 1 1 Relational Algebra Relational Algebra is : the formal description of how a relational database operates the mathematics which underpin SQL
5 E Lesson: Solving Monohybrid Punnett Squares with Coding
 5 E Lesson: Solving Monohybrid Punnett Squares with Coding Genetics Fill in the Brown colour Blank Options Hair texture A field of biology that studies heredity, or the passing of traits from parents to
Hvor finner vi flått på vårbeiter? - og betydning av gjengroing for flåttangrep på lam på vårbeite
 Hvor finner vi flått på vårbeiter? - og betydning av gjengroing for flåttangrep på lam på vårbeite Lucy Gilbert, Lise Grove, Unni Støbet Lande, Ingeborg Klingen, Kirstyn Brunker Gjenngroing På verdensbasis
Emneevaluering GEOV272 V17
 Emneevaluering GEOV272 V17 Studentenes evaluering av kurset Svarprosent: 36 % (5 av 14 studenter) Hvilket semester er du på? Hva er ditt kjønn? Er du...? Er du...? - Annet PhD Candidate Samsvaret mellom
Andrew Gendreau, Olga Rosenbaum, Anthony Taylor, Kenneth Wong, Karl Dusen
 Andrew Gendreau, Olga Rosenbaum, Anthony Taylor, Kenneth Wong, Karl Dusen The Process Goal Definition Data Collection Data Preprocessing EDA Choice of Variables Choice of Method(s) Performance Evaluation
Exercise 1: Phase Splitter DC Operation
 Exercise 1: DC Operation When you have completed this exercise, you will be able to measure dc operating voltages and currents by using a typical transistor phase splitter circuit. You will verify your
Speed Racer Theme. Theme Music: Cartoon: Charles Schultz / Jef Mallett Peanuts / Frazz. September 9, 2011 Physics 131 Prof. E. F.
 September 9, 2011 Physics 131 Prof. E. F. Redish Theme Music: Speed Racer Theme Cartoon: Charles Schultz / Jef Mallett Peanuts / Frazz 1 Reading questions Are the lines on the spatial graphs representing
UNIVERSITETET I OSLO ØKONOMISK INSTITUTT
 UNIVERSITETET I OSLO ØKONOMISK INSTITUTT Eksamen i: ECON1910 Poverty and distribution in developing countries Exam: ECON1910 Poverty and distribution in developing countries Eksamensdag: 1. juni 2011 Sensur
Generalization of age-structured models in theory and practice
 Generalization of age-structured models in theory and practice Stein Ivar Steinshamn, stein.steinshamn@snf.no 25.10.11 www.snf.no Outline How age-structured models can be generalized. What this generalization
Neural Network. Sensors Sorter
 CSC 302 1.5 Neural Networks Simple Neural Nets for Pattern Recognition 1 Apple-Banana Sorter Neural Network Sensors Sorter Apples Bananas 2 Prototype Vectors Measurement vector p = [shape, texture, weight]
Satellite Stereo Imagery. Synthetic Aperture Radar. Johnson et al., Geosphere (2014)
") Satellite Stereo Imagery Synthetic Aperture Radar Johnson et al., Geosphere (2014) Non-regular sampling Missing data due to lack of correlation, shadows, water, Potentially 3D as opposed to purely 2D (i.e.
Satellite Stereo Imagery Synthetic Aperture Radar Johnson et al., Geosphere (2014) Non-regular sampling Missing data due to lack of correlation, shadows, water, Potentially 3D as opposed to purely 2D (i.e.
0:7 0:2 0:1 0:3 0:5 0:2 0:1 0:4 0:5 P = 0:56 0:28 0:16 0:38 0:39 0:23
 UTKAST ENGLISH VERSION EKSAMEN I: MOT100A STOKASTISKE PROSESSER VARIGHET: 4 TIMER DATO: 16. februar 2006 TILLATTE HJELPEMIDLER: Kalkulator; Tabeller og formler i statistikk (Tapir forlag): Rottman: Matematisk
Dynamic Programming Longest Common Subsequence. Class 27
 Dynamic Programming Longest Common Subsequence Class 27 Protein a protein is a complex molecule composed of long single-strand chains of amino acid molecules there are 20 amino acids that make up proteins
EKSAMENSOPPGAVE I BI2034 Samfunnsøkologi EXAMINATION IN: BI Community ecology
 Norges teknisk-naturvitenskapelige universitet Institutt for Biologi EKSAMENSOPPGAVE I BI2034 Samfunnsøkologi EXAMINATION IN: BI2034 - Community ecology - Faglig kontakt under eksamen/contact person/subject
Databases 1. Extended Relational Algebra
 Databases 1 Extended Relational Algebra Relational Algebra What is an Algebra? Mathematical system consisting of: Operands --- variables or values from which new values can be constructed. Operators ---
Ole Isak Eira Masters student Arctic agriculture and environmental management. University of Tromsø Sami University College
 The behavior of the reindeer herd - the role of the males Ole Isak Eira Masters student Arctic agriculture and environmental management University of Tromsø Sami University College Masters student at Department
Dean Zollman, Kansas State University Mojgan Matloob-Haghanikar, Winona State University Sytil Murphy, Shepherd University
 Dean Zollman, Kansas State University Mojgan Matloob-Haghanikar, Winona State University Sytil Murphy, Shepherd University Investigating Impact of types of delivery of undergraduate science content courses
Dagens tema: Eksempel Klisjéer (mønstre) Tommelfingerregler
 Tommelfingerregler") UNIVERSITETET I OSLO INF1300 Introduksjon til databaser Dagens tema: Eksempel Klisjéer (mønstre) Tommelfingerregler Institutt for informatikk Dumitru Roman 1 Eksempel (1) 1. The system shall give an overview
UNIVERSITETET I OSLO INF1300 Introduksjon til databaser Dagens tema: Eksempel Klisjéer (mønstre) Tommelfingerregler Institutt for informatikk Dumitru Roman 1 Eksempel (1) 1. The system shall give an overview
HONSEL process monitoring
 6 DMSD has stood for process monitoring in fastening technology for more than 25 years. HONSEL re- rivet processing back in 990. DMSD 2G has been continuously improved and optimised since this time. All
2A September 23, 2005 SPECIAL SECTION TO IN BUSINESS LAS VEGAS
 2A September 23, 2005 SPECIAL SECTION TO IN BUSINESS LAS VEGAS SPECIAL SECTION TO IN BUSINESS LAS VEGAS 3A September 23, 2005 SEE, PAGE 8A Businesses seek flexibility. It helps them compete in a fast-paced,
Endelig ikke-røyker for Kvinner! (Norwegian Edition)
") Endelig ikke-røyker for Kvinner! (Norwegian Edition) Allen Carr Click here if your download doesn"t start automatically Endelig ikke-røyker for Kvinner! (Norwegian Edition) Allen Carr Endelig ikke-røyker
Endelig ikke-røyker for Kvinner! (Norwegian Edition) Allen Carr Click here if your download doesn"t start automatically Endelig ikke-røyker for Kvinner! (Norwegian Edition) Allen Carr Endelig ikke-røyker
NORWEGIAN UNIVERSITY OF SCIENCE AND TECHNOLOGY
 NORWEGIAN UNIVERSITY OF SCIENCE AND TECHNOLOGY Page 1 of 3 Faculty of Natural Sciences and Technology Department of Biology Subject teacher: Ana Séneca, Bård Pedersen, Terje Thun (73553409) EXAMINATION
Little Mountain Housing
 Little Mountain Housing Feedback from January 2012 Open Houses Presentation to Little Mountain Community Advisory Group Overview Open house attendance 409 signed in 600+ total Comment forms submitted 326
TFY4170 Fysikk 2 Justin Wells
 TFY4170 Fysikk 2 Justin Wells Forelesning 5: Wave Physics Interference, Diffraction, Young s double slit, many slits. Mansfield & O Sullivan: 12.6, 12.7, 19.4,19.5 Waves! Wave phenomena! Wave equation
NO X -chemistry modeling for coal/biomass CFD
 NO X -chemistry modeling for coal/biomass CFD Jesper Møller Pedersen 1, Larry Baxter 2, Søren Knudsen Kær 3, Peter Glarborg 4, Søren Lovmand Hvid 1 1 DONG Energy, Denmark 2 BYU, USA 3 AAU, Denmark 4 DTU,
PSi Apollo. Technical Presentation
 PSi Apollo Spreader Control & Mapping System Technical Presentation Part 1 System Architecture PSi Apollo System Architecture PSi Customer label On/Off switch Integral SD card reader/writer MENU key Typical
European Crime Prevention Network (EUCPN)
") European Crime Prevention Network (EUCPN) The EUCPN was set up by Council Decision 2001/427/JHA in May 2001 to promote crime prevention activity in EU Member States. Its principal activity is information
European Crime Prevention Network (EUCPN) The EUCPN was set up by Council Decision 2001/427/JHA in May 2001 to promote crime prevention activity in EU Member States. Its principal activity is information
EN Skriving for kommunikasjon og tenkning
 EN-435 1 Skriving for kommunikasjon og tenkning Oppgaver Oppgavetype Vurdering 1 EN-435 16/12-15 Introduction Flervalg Automatisk poengsum 2 EN-435 16/12-15 Task 1 Skriveoppgave Manuell poengsum 3 EN-435
Newtons fargeskive. Regnbuens farger blir til hvitt. Sett skiva i rask rotasjon ved hjelp av sveiva.
 Newtons fargeskive Regnbuens farger blir til hvitt. Sett skiva i rask rotasjon ved hjelp av sveiva. Se hva som skjer med fargene. Hvitt lys består av en blanding av alle farger. Når fargeskiva roterer
PETROLEUMSPRISRÅDET. NORM PRICE FOR ALVHEIM AND NORNE CRUDE OIL PRODUCED ON THE NORWEGIAN CONTINENTAL SHELF 1st QUARTER 2016
 1 PETROLEUMSPRISRÅDET Deres ref Vår ref Dato OED 16/716 22.06.2016 To the Licensees (Unofficial translation) NORM PRICE FOR ALVHEIM AND NORNE CRUDE OIL PRODUCED ON THE NORWEGIAN CONTINENTAL SHELF 1st QUARTER
Accuracy of Alternative Baseline Methods
 Accuracy of Alternative Baseline Methods Dr. Steven Braithwait Christensen Associates Energy Consulting IEPEC - Paris June 2010 Outline Demand response & role of baseline loads Measures of baseline performance
REMOVE CONTENTS FROM BOX. VERIFY ALL PARTS ARE PRESENT READ INSTRUCTIONS CAREFULLY BEFORE STARTING INSTALLATION
 2011-2014 FORD EXPLORER PARTS LIST Qty Part Description Qty Part Description 1 Bull Bar 2 12mm x 35mm Bolt Plates 1 Passenger/Right Mounting Bracket 2 12mm Nut Plate 1 Driver/Left Mounting Bracket 2 12mm
Eiendomsverdi. The housing market Update September 2013
 Eiendomsverdi The housing market Update September 2013 Executive summary September is usually a weak month but this was the weakest since 2008. Prices fell by 1.4 percent Volumes were slightly lower than
Moving Objects. We need to move our objects in 3D space.
 Transformations Moving Objects We need to move our objects in 3D space. Moving Objects We need to move our objects in 3D space. An object/model (box, car, building, character,... ) is defined in one position
Examination paper for BI2034 Community Ecology and Ecosystems
 Department of Biology Examination paper for BI2034 Community Ecology and Ecosystems Academic contact during examination: Ole Kristian Berg (91897518) Thor Harald Ringsby (91897032) James D. M. Speed (45770227)
SYNERGIES BETWEEN MEASURES FOR ADAPTATION, EMISSIONS TO AIR AND WATER QUALITY IN AGRICULTURE
 SYNERGIES BETWEEN MEASURES FOR ADAPTATION, EMISSIONS TO AIR AND WATER QUALITY IN AGRICULTURE Marianne Bechmann and Lillian Øygarden NIBIO Trondheim, EVALUATION OF SYNERGIES AND CONFLICTS Environmental
Examples and experience from restorations along Tana river on the norwegian side. Knut Aune Hoseth Head of northern region
 Examples and experience from restorations along Tana river on the norwegian side Knut Aune Hoseth Head of northern region Mapping of migration barriers 1998-2000 Interreg project Better understanding of
UNIVERSITETET I OSLO
 Kuldehypersensitivitet og konsekvenser for aktivitet En tverrsnittsstudie av pasienter med replanterte/revaskulariserte fingre Tone Vaksvik Masteroppgave i helsefagvitenskap Institutt for sykepleievitenskap
COUNTRY REPORT- NORWAY
 COUNTRY REPORT- NORWAY EUFRIN BOARD - NOV. 2015 Mekjell Meland Nibio Ullensvang JULY 1, 2015 2 23.11.2015 NIBIO KNOWLEDGE FOR LIFE Our future well-being depends on sustainable use of our natural resources.
MID-TERM EXAM TDT4258 MICROCONTROLLER SYSTEM DESIGN. Wednesday 3 th Mars Time:
 Side 1 av 8 Norwegian University of Science and Technology DEPARTMENT OF COMPUTER AND INFORMATION SCIENCE MID-TERM EXAM TDT4258 MICROCONTROLLER SYSTEM DESIGN Wednesday 3 th Mars 2010 Time: 1615-1745 Allowed
Software applications developed for the maritime service at the Danish Meteorological Institute
 Software applications developed for the maritime service at the Danish Meteorological Institute Anne Marie Munk Jørgensen (ammj@dmi.dk), Ove Kjær, Knud E. Christensen & Morten L. Mortensen Danish Meteorological
Physical origin of the Gouy phase shift by Simin Feng, Herbert G. Winful Opt. Lett. 26, (2001)
") by Simin Feng, Herbert G. Winful Opt. Lett. 26, 485-487 (2001) http://smos.sogang.ac.r April 18, 2014 Introduction What is the Gouy phase shift? For Gaussian beam or TEM 00 mode, ( w 0 r 2 E(r, z) = E
by Simin Feng, Herbert G. Winful Opt. Lett. 26, 485-487 (2001) http://smos.sogang.ac.r April 18, 2014 Introduction What is the Gouy phase shift? For Gaussian beam or TEM 00 mode, ( w 0 r 2 E(r, z) = E
BOASNEGLEN (LIMAX MANMUS) OG IBERIASNEGLEN (ARION LUCITANZCUS) I NORGE; UTBREDELSE, SPREDNING OG SKADEVIRKNINGER
 OG IBERIASNEGLEN (ARION LUCITANZCUS) I NORGE; UTBREDELSE, SPREDNING OG SKADEVIRKNINGER") Vitenskapsmuseet Rapport Zoologisk Serie 1997-4 BOASNEGLEN (LIMAX MANMUS) OG IBERIASNEGLEN (ARION LUCITANZCUS) I NORGE; UTBREDELSE, SPREDNING OG SKADEVIRKNINGER Dag Dolmen og Kirsten Winge Norges teknisk-naturvitenskapelige
Vitenskapsmuseet Rapport Zoologisk Serie 1997-4 BOASNEGLEN (LIMAX MANMUS) OG IBERIASNEGLEN (ARION LUCITANZCUS) I NORGE; UTBREDELSE, SPREDNING OG SKADEVIRKNINGER Dag Dolmen og Kirsten Winge Norges teknisk-naturvitenskapelige
VLSI Design for Yield on Chip Level
 IBM Systems and Technology Group Markus Bühler Jeanne Bickford Jason Hibbeler Jürgen Koehl DATE 2006 Outline Catastrophic Failures Defect Mechanisms State of the Art Novel Techniques Conclusion 2 Catastrophic
STILLAS - STANDARD FORSLAG FRA SEF TIL NY STILLAS - STANDARD
 FORSLAG FRA SEF TIL NY STILLAS - STANDARD 1 Bakgrunnen for dette initiativet fra SEF, er ønsket om å gjøre arbeid i høyden tryggere / sikrere. Både for stillasmontører og brukere av stillaser. 2 Reviderte
Kjell Arne Mork, Francisco Rey, Henrik Søiland
 Argo data in the Norwegian Sea Kjell Arne Mork, Francisco Rey, Henrik Søiland Institute of Marine Research, Norway Euro-Argo User Workshop, Paris June 21 Outline Institute Marine Research s monitoring
Eksamensoppgave i PSY3100 Forskningsmetode - Kvantitativ
 Psykologisk institutt Eksamensoppgave i PSY3100 Forskningsmetode - Kvantitativ Faglig kontakt under eksamen: Mehmet Mehmetoglu Tlf.: 91838665 Eksamensdato: 7. desember 2015 Eksamenstid (fra-til): 9.00-13.00
Passasjerer med psykiske lidelser Hvem kan fly? Grunnprinsipper ved behandling av flyfobi
 Passasjerer med psykiske lidelser Hvem kan fly? Grunnprinsipper ved behandling av flyfobi Øivind Ekeberg 5.september 2008 Akuttmedisinsk avdeling, Ullevål universitetssykehus Avdeling for atferdsfag, Universitetet
Hvor mye praktisk kunnskap har du tilegnet deg på dette emnet? (1 = ingen, 5 = mye)
") INF247 Er du? Er du? - Annet Ph.D. Student Hvor mye teoretisk kunnskap har du tilegnet deg på dette emnet? (1 = ingen, 5 = mye) Hvor mye praktisk kunnskap har du tilegnet deg på dette emnet? (1 = ingen,
INF247 Er du? Er du? - Annet Ph.D. Student Hvor mye teoretisk kunnskap har du tilegnet deg på dette emnet? (1 = ingen, 5 = mye) Hvor mye praktisk kunnskap har du tilegnet deg på dette emnet? (1 = ingen,
UNIVERSITETET I OSLO ØKONOMISK INSTITUTT
 1 UNIVERSITETET I OSLO ØKONOMISK INSTITUTT BOKMÅL Utsatt eksamen i: ECON2915 Vekst og næringsstruktur Eksamensdag: 07.12.2012 Tid for eksamen: kl. 09:00-12:00 Oppgavesettet er på 5 sider Tillatte hjelpemidler:
UNIVERSITY OF OSLO DEPARTMENT OF ECONOMICS
 UNIVERSITY OF OSLO DEPARTMENT OF ECONOMICS Postponed exam: ECON420 Mathematics 2: Calculus and linear algebra Date of exam: Tuesday, June 8, 203 Time for exam: 09:00 a.m. 2:00 noon The problem set covers
Do Now. Turn in Revolution reaction sheet I need 4 volunteers to pass back notebooks
 Do Now Turn in Revolution reaction sheet I need 4 volunteers to pass back notebooks Do Now What is your reaction to the picture? 4 Major Topics in Biology Ecology Evolution Genetics Human Body Objective
How Bridges Work Sgrad 2001
 How Bridges Work Sgrad 2001 The Basic s There are three major types of bridges: The beam bridge The arch bridge The suspension bridge prepared by Mr.S.Grad 2 The biggest difference between the three is
Stationary Phase Monte Carlo Methods
 Stationary Phase Monte Carlo Methods Daniel Doro Ferrante G. S. Guralnik, J. D. Doll and D. Sabo HET Physics Dept, Brown University, USA. danieldf@het.brown.edu www.het.brown.edu Introduction: Motivations
Our Trees. Our Roots. Our Future.
 Our Trees. Our Roots. Our Future. Photo: Svein Grønvold/NN Photo: Shutterstock Forests for a healthy climate Forests have great potential to reduce the impacts of climate change, because trees absorb carbon
Western Alaska CDQ Program. State of Alaska Department of Community & Economic Development
 Western Alaska State of Alaska Department of Community & Economic Development The CDQ program was formally approved in 1992 by the North Pacific Fishery Management Council and implemented by Governor
Graphs similar to strongly regular graphs
 Joint work with Martin Ma aj 5th June 2014 Degree/diameter problem Denition The degree/diameter problem is the problem of nding the largest possible graph with given diameter d and given maximum degree
Eksamen ENG1002/1003 Engelsk fellesfag Elevar og privatistar/elever og privatister. Nynorsk/Bokmål
 Eksamen 22.11.2012 ENG1002/1003 Engelsk fellesfag Elevar og privatistar/elever og privatister Nynorsk/Bokmål Nynorsk Eksamensinformasjon Eksamenstid Hjelpemiddel Eksamen varer i 5 timar. Alle hjelpemiddel
Confidence-based Data Management for Personal Area Sensor Nets
 Confidence-based Data Management for Personal Area Sensor Nets Nesime Tatbul, Stan Zdonik Brown University Mark Buller, Reed Hoyt, Steve Mullen USARIEM Talk Outline Warfighter Physiologic Status Monitoring
6 December 2011 DG CLIMA. Stakeholder meeting on LDV CO 2 emissions - Scene setter
 6 December 2011 DG CLIMA 1 Stakeholder meeting on LDV CO 2 emissions - Scene setter Context of 80-95% reduction 2 Keeping average global temperature increase below 2 C confirmed as global objective (UNFCCC-
05/08/2002 Bugøynes. 16/08/2002 Bugøynes
 FANGSTSEKSJONEN SENTER FOR MARINE RESSURSER TOKTRAPPORT Fartøy F/F Fangst Toktnummer 22 9 Prosjekttittel Seleksjon Konge krabbe Delprosjektnr. 627 Avgangsdato og sted Ankomststed og dato /8/22 Bugøynes
Call function of two parameters
 Call function of two parameters APPLYUSER USER x fµ 1 x 2 eµ x 1 x 2 distinct e 1 0 0 v 1 1 1 e 2 1 1 v 2 2 2 2 e x 1 v 1 x 2 v 2 v APPLY f e 1 e 2 0 v 2 0 µ Evaluating function application The math demands
Improving Customer Relationships
 Plain Language Association International s 11 th conference Improving Customer Relationships September 21-23, 2017 University of Graz, Austria hosted by Klarsprache.at Copyright of this presentation belongs
UNIVERSITY OF OSLO. Faculty of Mathematics and Natural Sciences
 Page 1 UNIVERSITY OF OSLO Faculty of Mathematics and Natural Sciences Exam in BIO4210/9210 Classification and Phylogeny Day of exam: 13. December 2011 Exam hours: 9.00-12.00 (3 hours) This examination
UNIVERSITETET I OSLO
 UNIVERSITETET I OSLO Det matematisk-naturvitenskapelige fakultet Eksamen i: KJB 492 Bioinformatikk Eksamensdag: Fredag 14. desember 2001 Tid for eksamen: Kl.: 9.00 13.00 Oppgavesettet er på 7 sider. Vedlegg:
Skog som biomasseressurs: skog modeller. Rasmus Astrup
 Skog som biomasseressurs: skog modeller Rasmus Astrup Innhold > Bakkgrunn: Karbon dynamikk i skog > Modellering av skog i Skog som biomassressurs > Levende biomasse > Dødt organisk materiale og jord >
Justeringsanvisninger finnes på de to siste sidene.
 d Montering av popup spredere Justeringsanvisninger finnes på de to siste sidene. Link til monteringsfilm på youtube: http://youtu.be/bjamctz_kx4 Hver spreder har montert på en "svinkobling", det vil si
Han Ola of Han Per: A Norwegian-American Comic Strip/En Norsk-amerikansk tegneserie (Skrifter. Serie B, LXIX)
") Han Ola of Han Per: A Norwegian-American Comic Strip/En Norsk-amerikansk tegneserie (Skrifter. Serie B, LXIX) Peter J. Rosendahl Click here if your download doesn"t start automatically Han Ola of Han Per:
Han Ola of Han Per: A Norwegian-American Comic Strip/En Norsk-amerikansk tegneserie (Skrifter. Serie B, LXIX) Peter J. Rosendahl Click here if your download doesn"t start automatically Han Ola of Han Per:
Issues and challenges in compilation of activity accounts
 1 Issues and challenges in compilation of activity accounts London Group on environmental accounting 21st meeting 2-4 November 2015 Statistics Netherlands The Hague Kristine E. Kolshus kre@ssb.no Statistics
FIRST LEGO League. Härnösand 2012
 FIRST LEGO League Härnösand 2012 Presentasjon av laget IES Dragons Vi kommer fra Härnosänd Snittalderen på våre deltakere er 11 år Laget består av 4 jenter og 4 gutter. Vi representerer IES i Sundsvall
Hvor mye teoretisk kunnskap har du tilegnet deg på dette emnet? (1 = ingen, 5 = mye)
") Emneevaluering GEOV325 Vår 2016 Kommentarer til GEOV325 VÅR 2016 (emneansvarlig) Forelesingsrommet inneholdt ikke gode nok muligheter for å kunne skrive på tavle og samtidig ha mulighet for bruk av power
Emneevaluering GEOV325 Vår 2016 Kommentarer til GEOV325 VÅR 2016 (emneansvarlig) Forelesingsrommet inneholdt ikke gode nok muligheter for å kunne skrive på tavle og samtidig ha mulighet for bruk av power
Kartleggingsskjema / Survey
 Kartleggingsskjema / Survey 1. Informasjon om opphold i Norge / Information on resident permit in Norway Hvilken oppholdstillatelse har du i Norge? / What residence permit do you have in Norway? YES No
Application of the ecosystem services framework to a sheep grazing experiment in the treeline ecotone
 Application of the ecosystem services framework to a sheep grazing experiment in the treeline ecotone Gunnar Austrheim, University Museum Norwegian University of Science and Technology, Norway, Number
Assessing second language skills - a challenge for teachers Case studies from three Norwegian primary schools
 Assessing second language skills - a challenge for teachers Case studies from three Norwegian primary schools The Visions Conference 2011 UiO 18 20 May 2011 Kirsten Palm Oslo University College Else Ryen
PIM ProsjektInformasjonsManual Tittel: REDUKSJON AV FLUORIDEKSPONERING I ALUMINIUMINDUSTRIEN INKLUDERT GRUNNLAG FOR KORTTIDSNORM FOR FLUORIDER
 SLUTTRAPPORT Innhold 1. Innledning 1.1 Deltakere 1.2 Bakgrunn 1.3 Mål 1.4 Organisasjon 2. Oppsummering 3. Summary in English 4. Referanser/References 1. INNLEDNING 1.1 Deltakere Alcan á Ísland Alcoa Fjarðaál
EKSAMENSOPPGAVE I BI2016 MOLEKYLÆR ØKOLOGI
 Norges teknisk-naturvitenskapelige universitet Institutt for biologi EKSAMENSOPPGAVE I BI2016 MOLEKYLÆR ØKOLOGI Faglig kontakt under eksamen: 1. aman. Hans K. Stenøien Tlf.: 9189 7592 - Eksamensdato: 06.06.2008
Föryngring och bete på rönn Erfaringer fra Norge
 Föryngring och bete på rönn Erfaringer fra Norge Gunnar Austrheim, James Speed, Anders Kolstad, Erling Solberg NTNU Vitenskapsmuseet, Norsk Institutt for Naturforskning (NINA) Innhold Hvordan har beitetrykket
UNIVERSITETET I OSLO ØKONOMISK INSTITUTT
 UNIVERSITETET I OSLO ØKONOMISK INSTITUTT BOKMÅL Eksamen i: ECON1710 Demografi grunnemne Eksamensdag: 10.12.2013 Sensur blir annonsert: 03.01.2014 Tid for eksamen: kl. 14:30 17:30 Oppgavesettet er på 5
Estimating Peer Similarity using. Yuval Shavitt, Ela Weinsberg, Udi Weinsberg Tel-Aviv University
 Estimating Peer Similarity using Distance of Shared Files Yuval Shavitt, Ela Weinsberg, Udi Weinsberg Tel-Aviv University Problem Setting Peer-to-Peer (p2p) networks are used by millions for sharing content
Building conservation in practice
 Building conservation in practice Aadne Gunnar Sollid Cultural heritage leader in Aust- Agder county. Aust-Agder fylkeskommune 2 Synagogen er blant de eldste eksisterende tresynagogen i Øst-Europa. Den
Forecast Methodology September LightCounting Market Research Notes
 Forecast Methodology September 2015 LightCounting Market Research Notes Vladimir Market Kozlov Forecast Methodology, September, September, 2015 2015 1 Summary In summary, the key assump=on of our forecast
Minimumskrav bør være å etablere at samtykke ikke bare må være gitt frivillig, men også informert.
 Sensorveiledning SPED1200 vår 2018 NB! Studentene har fått beskjed om at de kan bruke engelske ord og uttrykk i besvarelsen uten at dette betraktes som negativt. Dette skal altså ikke trekke ned i vurderingen.
KROPPEN LEDER STRØM. Sett en finger på hvert av kontaktpunktene på modellen. Da får du et lydsignal.
 KROPPEN LEDER STRØM Sett en finger på hvert av kontaktpunktene på modellen. Da får du et lydsignal. Hva forteller dette signalet? Gå flere sammen. Ta hverandre i hendene, og la de to ytterste personene
Baltic Sea Region CCS Forum. Nordic energy cooperation perspectives
 Norsk mal: Startside Baltic Sea Region CCS Forum. Nordic energy cooperation perspectives Johan Vetlesen. Senior Energy Committe of the Nordic Council of Ministers 22-23. april 2015 Nordic Council of Ministers.
May legally defined terms be useful for improved interoperability in the public sector?
 May legally defined terms be useful for improved interoperability in the public sector? Prof. Dag Wiese Schartum, Norwegian Research Center for Computers and Law, University of Oslo How may terms be legally
The regulation requires that everyone at NTNU shall have fire drills and fire prevention courses.
 1 The law The regulation requires that everyone at NTNU shall have fire drills and fire prevention courses. 2. 3 Make your self familiar with: Evacuation routes Manual fire alarms Location of fire extinguishers
Our Trees. Our Roots. Our Future.
 Our Trees. Our Roots. Our Future. Photo: Svein Grønvold/NN Photo: Shutterstock Forests for a healthy climate Forests have great potential to reduce the impacts of climate change, because trees absorb carbon
GEF2200 Atmosfærefysikk 2017
 GEF2200 Atmosfærefysikk 2017 Løsningsforslag til sett 3 Oppgaver hentet fra boka Wallace and Hobbs (2006) er merket WH06 WH06 3.18r Unsaturated air is lifted (adiabatically): The rst pair of quantities
Innhold. Instruks for melding av hærverk. ID1743-a- hærverk. IE76286-b- Trafikkdetektor Leggebeskrivelse E og E
 Statens vegvesen Region Midt Elektrokontrakt Nordmøre og Romsdal Innhold Mappe I - Omfatter aktuelle drifts-/vedlikeholdsinstrukser og annen supplerende og utdypende grunnlagsinformasjon og/eller kravspesifikasjon
Sensorveiledning SPED1200 vår 2018
 Sensorveiledning SPED1200 vår 2018 NB! Studentene har fått beskjed om at de kan bruke engelske ord og uttrykk i besvarelsen uten at dette betraktes som negativt. Dette skal altså ikke trekke ned i vurderingen.
Nytt EU-direktiv om forebygging av stikkskader, betydning for oss? Dorthea Hagen Oma Smittevernlege Helse Bergen
 Nytt EU-direktiv om forebygging av stikkskader, betydning for oss? Dorthea Hagen Oma Smittevernlege Helse Bergen The EU Sharps Directive blei vedtatt i mai 2010 direktivet er juridisk bindande også i
Cylindrical roller bearings
 Cylindrical roller bearings Cylindrical roller bearings 292 Definition and capabilities 292 Series 292 Variants 293 Tolerances and clearances 294 Design criteria 296 Installation/assembly criteria 297
E-Learning Design. Speaker Duy Hai Nguyen, HUE Online Lecture
 E-Learning Design Speaker Duy Hai Nguyen, HUE Online Lecture Design Educational Design Navigation Design Educational Design Some Important Considerations: 1. Authentic learning environment: For effective
What is is expertise expertise? Individual Individual differ diff ences ences (three (thr ee cent cen r t a r l a lones): easy eas to to test
: easy eas to to test") Expertise in planning & estimation What is it and can one improve it? Jo Hannay (Simula) 1 What is expertise? Individual differences (three central ones): easy to test Personality easy to test Intelligence
Expertise in planning & estimation What is it and can one improve it? Jo Hannay (Simula) 1 What is expertise? Individual differences (three central ones): easy to test Personality easy to test Intelligence
Q2 Results July 17, Hans Stråberg President and CEO. Fredrik Rystedt CFO
 Q2 Results 2007 July 17, 2007 Hans Stråberg President and CEO Fredrik Rystedt CFO Q2 Highlights EBIT (SEKb) EBIT margin (%) 2.5 2 1.5 1 0.5 0 Q1 Q2 Q3 Q4 Q1 Q2 Q3 Q4 Q1 Q2 8% 7% 6% 5% 4% 3% 2% 1% 0% Group
UNIVERSITY OF OSLO DEPARTMENT OF ECONOMICS
 UNIVERSITY OF OSLO DEPARTMENT OF ECONOMICS English Postponed exam: ECON2915 Economic growth Date of exam: 11.12.2014 Time for exam: 09:00 a.m. 12:00 noon The problem set covers 4 pages Resources allowed:
Oppgave. føden)? i tråd med
? i tråd med") Oppgaver Sigurd Skogestad, Eksamen septek 16. des. 2013 Oppgave 2. Destillasjon En destillasjonskolonne har 7 teoretiske trinn (koker + 3 ideelle plater under føden + 2 ideellee plater over føden + partielll
Oppgaver Sigurd Skogestad, Eksamen septek 16. des. 2013 Oppgave 2. Destillasjon En destillasjonskolonne har 7 teoretiske trinn (koker + 3 ideelle plater under føden + 2 ideellee plater over føden + partielll
Oppgave 1a Definer følgende begreper: Nøkkel, supernøkkel og funksjonell avhengighet.
 TDT445 Øving 4 Oppgave a Definer følgende begreper: Nøkkel, supernøkkel og funksjonell avhengighet. Nøkkel: Supernøkkel: Funksjonell avhengighet: Data i en database som kan unikt identifisere (et sett