Report. Memo report. Collection of project memos
|
|
|
- Lukas Samuelsen
- 5 år siden
- Visninger:
Transkript

1 - Unrestricted Report Memo report Collection of project memos Authors Kaja Cecilie Hellstrøm Per S. Daling, Ute Brönner, Kristin Rist Sørheim, Marius Johnsen, Frode Leirvik SINTEF Ocean AS Miljøteknologi
2
3
4 Document history DATE DESCRIPTION Draft Merged draft Final Final version approved by client Page 4 of 306
5 Table of contents enclosed project memos Introduction... 6 Dispergerbarhet til marine dieseloljer... 7 Spredningsegenskaper til GO og WRG Renneforsøk med MGO og WRG Properties and dispersibility of Hybrid fuel oils Dispersibility of Shell ULSFO and HDME Meso-scale testing of HDME 50 and Shell ULSFO Ignitability study Marine diesel fuel oils and hybrid fuel oils Input to OWM and predictions Marine diesel fuel oils and hybrid fuel oils Page 5 of 306
6 Introduction In 2014, the Norwegian Coastal Administration (NCA, Kystverket) engaged SINTEF to perform a preliminary study on five different diesel qualities, where the aim was to map the most relevant properties under arctic conditions. This was a response to cover information gaps that had been revealed during an oil spill preparedness analysis (EPA) of the Jan Mayen and Svalbard areas (Kystverket, 2014a). The results from the preliminary study were presented in a report, Sørheim and Daling (2015), but the need for further studies were apparent, particularly regarding operationally relevant properties such as emulsifying properties, dispersibility and toxicity. In January 2015, new regulations regarding sulphur emission in Sulphur Emission Control Areas (SECA) were enforced, reducing the allowed content of sulphur in marine fuel oils from 1 % m/m (mass/mass) to 0.1 % m/m. In addition, changes in sulphur emission regulations outside SECA areas were announced to occur in 2020, reducing allowed sulphur content in fuel oils from 3.5 % m/m to 0.5 % m/m. With these changes, new low-sulphur fuel qualities entered the marked and their demand was (and is) expected to increase in the coming years. These new fuel oils were given the nickname Hybrid fuel oils, since they have been designed to have low sulphur content and diesel like qualities while still having properties suitable for combustion in heavy fuel oil engines (CIMAC, 2017). Very little information regarding these new fuel oil types are available, and a need characterisation of the physicalchemical properties and weathering behaviour of these oil types were evident. On request from NCA, SINTEF Environmental technology has performed an extensive study with relevance for oil spill response operations on a wide spectre of marine diesel oils and hybrid fuel oils in the period Three DMA diesel qualities (MGO from Esso Slagen, GO from Mongstad and Rotterdam Diesel from the Netherlands) were chosen, as was a DMB/DMC quality fuel (WRG from Mongstad). In addition, the Hybrid fuel oils Shell ULSFO (Ultra Low Sulphur Fuel Oil from Shell) and HDME 50 (Heavy Distillate Marine ECA from ExxonMobil) have been included in the study. These fuel types were relevant as they are used on vessels in Norwegian and/or European waters. Several activities have been performed in the study, and these are listed in Table 1-1. Results from the various activities have been reported continuously to NCA in the form of project memos, written in both Norwegian (regarding marine diesel oils) and English (regarding Hybrid fuel oils). This report consist of a collection of these memos, and provide full details of all performed work and detailed results. The aim of this report is to provide the interested reader a work of reference for all the obtained results and findings this extensive study has given. A separate summarising report has also been written (Hellstrøm and Daling, 2017), and provide the key findings from the study regarding weathering properties of marine fuel oils. In addition, results from the study of water accommodated fractions (WAF) and toxicity of the tested oils have been presented in a separate report (Faksness and Altin, 2017). Table 1-1: Overview of the different activities in the project listed for each fuel oil. Activity\oil GO MGO Rotterdam Diesel WRG ULSFO HDME 50 Bench-scale testing, (2) 13 (20) C (x) x* (-) (x) x* (-) x (x) x* (-) (x) x (x) (x) x (x) Dispersibility IFP/MNS (13 C) x x x** x x x study FET-test (2)13(20) C (x) x (x) (x) - (x) Meso-scale flume testing (2) 13 C - (x)x - (x)x (x)x (x)x Ignitability: Small scale testing x x x x x - Ignitability: up-scaled testing x x x x x x Spreadability x - - x - - WAF and toxicity study x x x x x x OWM oil weathering model: Predicted behaviour x x x x x x *Emulsifying properties were tested at 10 C ** Only a screening study was performed Page 6 of 306
7 SINTEF Ocean AS Postadresse: Postboks 4762 Torgarden 7465 Trondheim Switchboard: Foretaksregister: NO MVA Prosjektnotat Dispergerbarhet til marine dieseloljer MGO, GO, WRG og Rotterdam diesel VERSJON DATO FORFATTER(E) Kaja Cecilie Hellstrøm OPPDRAGSGIVER(E) Kystverket (Norwegian Coastal Administation) GRADERING Åpen OPPDRAGSGIVERS REF. Silje Berger ANTALL SIDER OG VEDLEGG: 12 SAMMENDRAG Notatet omhandler resultater fra screening av seks ulike dispergeringsmidler utført på fire marine dieseloljer. I tillegg oppgis resultater fra doseringstesting med Dasic NS for 3 dieseloljer, og et utvidet dispergerbarhetstudium for en dieselolje (WRG). PROSJEKTLEDER Kaja Cecilie Hellstrøm GODKJENT AV Mimmi Throne-Holst Dette memoet inngår i rapport OC2017 A-123 Page 7 of 306
8 Innholdsfortegnelse 1 Bakgrunn og målsetting Metodikk Screening og doseringstesting Systematisk dispergerbarhetstesting Tidsvindu for bruk av dispergeringsmiddel Konklusjon Referanser Page 8 of 306
9 1 Bakgrunn og målsetting Dispergerbarhetstestingen ble utført for å dokumentere den relative effektiviteten til dispergeringsmidler på ulike fraksjoner av de to dieseloljene MGO 500 ppm S, GO (Farget) 10 ppm S samt Wide Range Gas oil (WRG) ved 13 C og 2 C. Emulsjonstestingen utført i forstudiet viste at WRG-oljen tok opp vann og dannet løse emulsjoner, og dispergerbarhet til WRG emulsjoner ble derfor også testet. I tillegg ble effektiviteten til dispergeringsmiddel testet på vannfri fersk og forvitret olje for begge dieseloljene og WRG oljen. Dispergerbarhetstestingen ble utført i henhold til krav i forurensingsforskriften, kap. 19, for bruk av dispergeringsmiddel på norsk sokkel, og innbefattet både en screening av ulike dispergeringsmidler og test av ulike doseringer av et utvalgt dispergeringsmiddel med god effektivitet (Dasic NS). Både lav-energitesting (IFP) og høy-energitesting (MNS) ble benyttet til disse analysene samt til videre effektivitetstesting. En tredje dieselolje, Rotterdam Diesel, ble testet for effektivitet ved bruk av ulike dispergeringsmidler ved et senere tidspunkt, og resultatene er presentert sammen med MGO, GO og WRG-oljene. Tabell 1 lister opp de produkter som omtales i notatet sammen med de respektive SINTEF ID-numrene. Tabell 1: Oversikt over oljer omtalt i kapittelet. Olje SINTEF ID nr. MGO 500 ppm S GO (Farget) 10 ppm S Rotterdam Diesel WRG Metodikk Flere laboratoriemetoder eksisterer for effektivitetstesting av dispergeringsmidler, og resultatene av disse metodene varierer i hovedsak på bakgrunn av at forskjellige energitilførsel benyttes i testene. SINTEF benytter IFP og MNS metodene til sin standardiserte dispergerbarhetstesting og til kartlegging av tidsvindu for kjemisk dispergerbarhet (i henhold til dagens forskrifter). IFP (Institute Francais du Petrole test, Bocard et al., 1984) er også den metoden som benyttes for godkjenning av dispergeringsmidler i Frankrike. Det er en lav-energi test (ikke-brytende bølger) som tar hensyn til en naturlig fortynning av dispergert olje i vannsøylen, og representerer derfor en noe mer realistisk tilnærmelse til feltforsøk sammenlignet med andre testmetoder. MNS (Mackay and Szeto, 1980) er en metode hvor energitilførselen foregår ved å blåse luft over olje/vann overflaten. Dette produserer en sirkulær bølgebevegelse som er estimert å tilsvare middels til høy sjøtilstand med brytende bølger. Begge metodene er vist i Figur 2-1. Page 9 of 306
10 Figur 2-1: Oppsett av IFP og MNS-metodikkene Page 10 of 306

11 3 Screening og doseringstesting Det ble benyttet seks dispergeringsmidler i screeningen i tillegg til at effektiviteten uten tilsetning av dispergeringsmiddel ble testet. Resultatene for screening av de tre dieseloljene og WRG presenteres i Tabell 3-1 og Figur 3-1, og viser at Dasic NS og Corexit 9500 var de beste blant de testede dispergeringsmidlene for alle dieseloljene. Rotterdam Dieselen viste generelt noe lavere dispergerbarhet sammenlignet med de øvrige dieseloljene og WRG-oljen. Valg av dispergeringsmiddel til videre testing ble diskutert mellom og internt hos SINTEF og Kystverket, og valget falt til slutt på Dasic NS ut fra tilgjengelighet i Norge. Doseringstestingen omfattet fire ulike dose-til-olje ratio (DOR) samt uten bruk av dispergeringsmiddel, og resultatene er gitt i Tabell 3-2 og vist i Figur 3-2. Doseringstesten ble ikke utført på Rotterdam Diesel oljen. For lav-energitesten IFP var effektiviteten høyere med høyere dosering for alle oljene, og en markant økt effektivitet ble observert for bruk av dispergeringsmiddel sammenlignet med resultater fra tester uten dispergeringsmiddel. Resultatene fra MNS-testene gir generelt høyere effektivitetsverdier, og gir dermed ikke de samme klare tegnene på økt effektivitet med økt dosering. Dette viser at energi-tilførsel vil være en viktig faktor for optimal dispergering av dieselene, og ved rolig vær under et oljeutslipp kan tilførsel av energi, ved hjelp av f.eks. fi-fi systemer, bidra til økt dispergering. Effektivitet til seks kjemiske dispergeringsmidler er oppgitt for de tre dieseloljene og WRG i tillegg til effektivitet uten påføring av kjemisk dispergeringsmiddel. Tabell 3-1: Screening av effektivitet til forskjellige dispergeringsmidler på dieseloljene MGO, GO (Farget), Rotterdam diesel og WRG Dispergeringsmiddel (DOR 1:25) MGO 500 ppm S, 250 C+/vannfri (ID: ) GO (Farget) 10 ppm S 250 C+/vannfri (ID: ) Rotterdam Diesel 250 C+/vannfri (ID: ) WRG Fersk/vannfri (ID: ) Corexit Dasic NS Finasol OSR Gamlen OD Superdispersant Radiagreen Uten dispergeringsmiddel 0,5 0,5 0,2 0,3 Figur 3-1: Stolpediagram over effektiviteten til de ulike dispergeringsmidlene benyttet i screening med IFP-metodikk, utført ved 13 C Page 11 of 306
12 Effektivitet % Effektivitet % Tabell 3-2: Resultater av doseringstesting med Dasic NS på tre dieseloljer Dispergeringsmiddel (Dosering) Effektivitet av dispergeringsmiddel på 250 C+/ vannfri fraksjon i % MGO 500 ppm S (ID: ) GO (Farget) 10 ppm S (ID: ) WRG (fersk) (ID: ) IFP MNS IFP MNS IFP MNS Dasic NS (1:25) Dasic NS (1:50) Dasic NS (1:100) Dasic NS (1:200) Uten Dasic NS 0,5 55 0,5 65 0,3 22 *: Viskositet til Rotterdam Diesel 250 C+ ble målt til 14 mpa s ved 13 C IFP MGO 500 ppm S GO (Farget) 10 ppm S WRG :25 1:50 1:100 1:200 Uten disp.middel Dosering, DOR Figur 3-2: Doseringsresultater fra IFP-testen utført ved 13 C presentert som stolpediagram MNS MGO 500 ppm S GO (Farget) 10 ppm S WRG :25 1:50 1:100 1:200 uten disp.middel Dosering, DOR Figur 3-3: Resultat fra doseringstesting med MNS-testen, utført ved 13 C Page 12 of 306
13 4 Systematisk dispergerbarhetstesting I tillegg til screening og doseringstesting ble det utført dispergerbarhetstesting på fersk diesel av MGO og GO (Farget), og emulsjoner av WRG og fersk olje. Dette ble utført ved både 2 C og 13 C og med doseringsrate 1:25 for alle tester. Resultatene av disse testene vises i Tabell 4-1 og Tabell 4-2. Både MGO og GO (farget) viste god dispergerbarhet ved både 2 og 13 C, og ingen klare temperaturavhengige trender ble observert. Viskositeten til disse dieselene varierte lite mellom disse temperaturforholdene. Tabell 4-1: dispergerbarhet til fersk og forvitret MGO og GO (farget), ved 2 C og 13 C Diesel MGO (SINTEF ID ) GO (farget) (SINTEF ID: ) Temperatur 13 C 2 C 13 C 2 C Fraksjon (vannfri) Viskositet (mpa s) 10 s -1 Viskositet (mpa s) 100 s -1 Effektivitet (%) IFP MNS Fersk C Fersk C Fersk C Fersk C WRG-oljen dannet ustabile emulsjoner og dispergerbarheten til disse ble testet. Dispergerbarheten virket ikke å bli påvirket av økende volum % vann i emulsjonen. Derimot ble det observert en markant redusert dispergerbarhet ved 2 C under IFP-testen sammenlignet med dispergering ved 13 C. Lignende resultater ble også observert for MNS testen, og dette er vist i Figur 4-1 og Figur 4-2. Resultatene er gitt i Tabell 4-2. Viskositetene til de testede WRG-emulsjonene varierte i forhold til testtemperaturen og generelt førte høyere viskositet til lavere effektivitet av dispergering. Tabell 4-2: Effektivitet av dispergering av emulsjoner av fersk WRG ved ulike temperaturer og med varierende vanninnhold Temperatur 2 C 13 C Vanninnhold i emulsjon (Vol. %) Wide Range Gas oil (SINTEF ID: ) Viskositet (mpa s, 10 s -1 ) Viskositet (mpa s, 100 s -1 ) Effektivitet (wt. %) IFP MNS Page 13 of 306
14 Effektivitet % Effektivitet % WRG ved to temperaturer - IFP 13 C 2 C Max Volum % vann Figur 4-1: IFP-resultat for vannfri olje og emulsjoner av WRG ved to temperaturer. Vanninnholdet i emulsjon er gitt på x-aksen, og effektiviteten i % på y-aksen WRG ved to temperaturer - MNS 13 C 2 C Max Volum % vann i emulsjon Figur 4-2: MNS-resultat for vannfri olje og emulsjoner av WRG ved to temperaturer. Vanninnholdet i emulsjon er gitt på x-aksen, og effektiviteten i % på y-aksen Page 14 of 306
15 5 Tidsvindu for bruk av dispergeringsmiddel Verken MGO eller GO (Farget) viste emulgerende egenskaper under emulsjonstesting i forprosjektet. Dispergerbarhetstestingen omfattet derfor kun testing på vannfri diesel og vannfritt residu ved 2 og 13 C. Både MGO og GO dispergerte godt under de testede forholdene, og dette gjaldt også de forvitrete fraksjonene. Det ble utført tester på alle dieselene uten bruk av kjemisk dispergeringsmiddel for å få en indikasjon på den naturlige dispergerbarheten til hver av dieselene. Ved bruk av IFP-metoden viste ingen av dieselene naturlig dispergerbarhet (ikke bruk av dispergeringsmiddel), effektiviteten var mindre enn 1 % for alle tre dieselene samt WRG-oljen. Til sammenligning viste alle dieselene høyere dispergerbarhet under høy-energi MNS-test (mellom %), noe som også ble observert for testene utført med dispergeringsmiddel. Effektiviteten var likevel lavere for testene uten dispergeringsmiddel sammenlignet med testene med dispergeringsmiddel ( %). WRG-oljen viste lavest effektivitet ved MNS-test uten dispergeringsmiddel (22 %). Dispergerbarhetstestingen av WRG-dieselen viste også store forskjeller i effektivitet avhengig av testtemperatur. IFP-testen ved 2 C gav resultater på mindre enn 20 % effektivitet, mens samme testing ved 13 C gav effektivitet nær eller over 80 %. Også MNS-testen viste lavere effektivitet for dispergering av emulsjoner av WRG ved 2 C sammenlignet med dispergering av emulsjoner ved 13 C. Variasjonen i effektivitet skyldes trolig at emulsjonene oppnår en høyere viskositet ved kaldere temperaturer, som vist i ved testing av emulgerende egenskaper og under renneforsøk med oljen. Økningen i viskositet kan forhindre dispergeringsmiddel fra å trekke inn i emulsjonen/oljen etter påføring, og på den måten hindre dispergeringsmiddelet fra å endre egenskapene til oljen/emulsjonen. Dersom temperatur-forholdene er under stivnepunktet for oljen kan emulsjonen/oljen stivne og på samme vis forhindre at dispergeringsmiddelet fra å trekke inn i oljen/emulsjonen. At oljen/emulsjonen stivner antas ikke å være relevant for WRG-oljen da denne har et stivnepunkt på -24 C. Den reduserte dispergerbarheten for WRG ved 2 C var overraskende ettersom emulsjonsviskositeten fortsatt var forholdsvis lav ved denne temperaturen. Det er mulig at den kjemiske sammensetningen til WRG kan påvirke dispergerbarheten, men det er ikke kjent hvilke komponenter som utøver denne effekten. Et annet dispergeringsmiddel kan potensielt være bedre egnet for bruk på emulsjoner av WRG ved lave temperaturer. Under renneforsøket som ble utført med WRG ved 2 C viste Corexit 9500 bedre effektivitet enn Dasic NS, men det er uvisst om dette skyldes total mengde påført dispergeringsmiddel eller de ulike egenskapene til Dasic NS og Corexit Screeningen av dispergeringsmiddel ble utført på vannfri WRG. Resultatene fra testingen med WRG fra begge temperaturer og testmetoder er vist i Figur 5-1 sammen med et estimat for viskositet hvor dispergerbarheten til dieseloljen reduseres. Ettersom begge testtemperaturer er lagt som grunnlag, vil estimatet trolig være konservativt under sommerforhold ettersom 2 C resultatene er utslagsgivende for den satte grensen. Under kalde forhold regnes oljen for å ha redusert dispergerbarhet. Basert på resultatene presentert i Figur 5-1 er det estimert at WRG vil ha en redusert dispergerbarhet ved viskositeter på mer enn 300 mpa s. En øvre grense for viskositet hvor dieseloljen ikke vil være dispergerbar har ikke vært mulig å sette basert på de foreliggende resultatene fra dispergerbarhetstestingen. Resultatene fra renneforsøkene som er utført på WRG-oljen viser bedre effektivitet av påføring av dispergeringsmiddel ved lavere viskositeter. Under det innledende forsøket gav påføring av dispergeringsmiddel svært god effekt, og viskositeten før påføring av dispergeringsmiddel var 193 mpa s. Under det standardiserte renneforsøket utført ved 13 C var viskositeten til WRG 505 mpa s rett før dispergeringsmiddel ble påført, og effektiviteten var mindre enn den observert under det innledende forsøket (13 C). Under det standardiserte forsøket utført med WRG ved 2 C, var viskositeten oppe i 548 mpa s rett før påføring av dispergeringsmiddel, men denne økte til 1536 mpa s etter første påføring av dispergeringsmiddel. Dispergerbarheten til WRG var generelt dårlig under forsøket ved 2 C. Basert på resultatene fra dispergerbarhetstestingen er det satt en nedre grense for dispergerbarhet for WRGoljen. Over denne grensen regnes dieseloljen å ha redusert dispergerbarhet. Tilstrekkelige data var ikke tilgjengelig for å sette en grense for når oljen regnes som ikke dispergerbar. Page 15 of 306
16 Figur 5-1: dispergerbarhet til WRG presentert i forhold til viskositet til testemulsjon/-olje. Grensen for redusert dispergerbarhet er satt til 300 mpa s. De to pilene indikerer emulsjonsviskositetene hvor effektiviteten vil være < 50 % for IFP-metodikken og < 75 % for MNS-metodikken. Grensen for redusert dispergerbarhet er satt som emulsjonsviskositeten som er antatt å resultere i < 50 % effektivitet med IFP-metodikken. Page 16 of 306
17 6 Konklusjon MGO og GO (farget) viser god dispergerbarhet for fersk og forvitret diesel ved 2 og 13 C, og disse dieselene viser relativ høy grad av naturlig dispergering ved brytende bølger. Bruk av dispergeringsmiddel er likevel vist å forbedre dispergerbarheten til dieselen, spesielt under rolige vindforhold. De samme trendene ble observert for Rotterdam diesel. Det ble kun utført screening ved 13 C med denne dieselen, og resultatene viser den samme fordelen ved bruk av dispergeringsmiddel fremfor naturlig dispergering. WRG-oljen hadde emulgerende egenskaper og emulsjoner av denne oljen ble testet for dispergerbarhet. Store forskjeller i dispergerbarhet ble observert avhengig av temperatur; det ble observert høyere viskositeter hos den vannfrie dieselen og dens emulsjoner ved 2 C sammenlignet med 13 C, og dårligere dispergerbarhet ved 2 C enn 13 C. Ved høyere viskositeter kan dispergeringsmiddelet ha større problemer med å trekke inn i emulsjonen, og dermed ikke ha den ønskede effekten i grenseflaten mellom diesel og vann. Økt dosering eller gjentatt påføring kan ha en positiv innvirkning på effektiviteten av dispergering. Doseringstesten viste at økt dosering gav en høyere effektivitet under lav-energi testen (IFP), mens denne trenden ikke ble observert i høyenergi testen (MNS). Gjentatt påføring av dispergeringsmiddel kan generelt resultere i økt effektivitet ettersom dispergeringsmiddel fra førstegangs påføring kan bidra til en endring av emulsjonens egenskaper, blant annet ved å redusere vanninnholdet og viskositeten. Dette ble ikke testet i benke-skala dispergerbarhetstesting, men er diskutert i notatet som omhandler de utførte renneforsøkene. Resultatene fra dispergerbarhetstestingen av WRG ble benyttet til å estimere et tidsvindu for dispergerbarhet basert på viskositet. Ved 2 C regnes oljen å ha redusert dispergerbarhet, og de lave resultatene fra forsøkene ved 2 C påvirker estimatet for tidsvinduet. Estimatet for redusert dispergerbarhet er ved emulsjonsviskositeter som overskrider 300 mpa s. Tidsvinduet regnes som konservativt for sommertemperaturer (13 C), ettersom resultater fra 2 C testing også ligger til grunn for estimatet og bidrar til at grensen for viskositet hvor emulsjonen regnes å ha redusert dispergerbarhet blir lavere. Emulsjonene som ble dannet ved 13 C viste generelt god dispergerbarhet, også over 300 mpa s. Tidsvinduet som er estimert tar ikke hensyn til den kjemiske sammensetningen av WRG, dersom denne påvirker dispergerbarheten til oljen. Valg av dosering, DOR (Dosage to Oil Ratio) bør vurderes i forhold til været ettersom det er observert forskjeller i effektivitet av dispergeringsmiddel i forhold til energinivå. IFP-resultatene indikerer at det ved rolige værforhold være nødvendig med en høyere dosering av dispergeringsmiddel for å oppnå maksimal effekt (DOR = 1:25). Eventuell bruk av kunstig turbulens, som MOB-båter, kan bidra til økt dispergering, og dermed redusere den nødvendige DOR noe. I værforhold med høyere naturlig turbulens kanen lavere dosering av Dasic NS (DOR = 1:100) være tilstrekkelig for å oppnå tilfredsstillende dispergering for alle de tre testede oljene under sommertemperaturer. Rotterdam Dieselen gjennomgikk ikke doseringstesting. For WRG-oljen må også temperaturforholdene tas i betraktning, og under rolige forhold kan høy DOR i tillegg til kunstig turbulens være nødvendig for å oppnå ønsket grad av dispergering. Page 17 of 306
18 7 Referanser Bocard, C., Castaing, C. G. and Gatellier, C "Chemical oil dispersion in trials at sea and in laboratory tests: The key role of the dilution process." Oil spill chemical dispersants: Research Experience and recommendations, ASTM STP 840. (T. E. Allen, ed.), Philadelphia, USA, pp Mackay, D. and Szeto, F "Effectiveness of oil spill dispersants - development of a laboratory method and results for selected commercial products." Institute of Environmental Studies, University of Toronto, Publ. no. EE-16. Page 18 of 306
19 SINTEF Ocean AS Postadresse: Postboks 4762 Torgard 7465 Trondheim Switchboard: Foretaksregister: NO MVA Prosjektnotat Spredningsegenskaper til GO og WRG VERSJON DATO FORFATTER(E) Kaja Cecilie Hellstrøm, Per S. Daling, Ute Brönner, Kristin Rist Sørheim, OPPDRAGSGIVER(E) Kystverket (Norwegian Coastal Administation) GRADERING Restricted OPPDRAGSGIVERS REF. Silje Berger ANTALL SIDER OG VEDLEGG: 19 med vedlegg SAMMENDRAG Dette notatet inneholder resultater fra tester av spredningsegenskapene til GO og WRG, en beskrivelse av testmetodikken samt en kort forklaring for bakgrunnen og viktigheten av de utførte testene. PROSJEKTLEDER Kaja Cecilie Hellstrøm GODKJENT AV Mimmi Throne-Holst Dette memoet inngår i rapport OC2017 A-123 Page 19 of 306
20 Innholdsfortegnelse 1 Bakgrunn Målsetting A Bilder fra spredningsforsøk A.1 Bildedokumentasjon fra spredningsforsøk med WRG/Norne-blanding A.2 Billed-dokumentasjon fra spredningsforsøk med ren WRG A.3 Billed-dokumentasjon fra spredningsforsøk med farget Gassolje Page 20 of 306
21 1 Bakgrunn Spredningsstudier av Wide Range Gas Oil (WRG) og Gas Oil (GO farget) diesel ble utført som supplerende forsøk til spredningsstudier finansiert gjennom Tynne Oljefilmer (TOF) prosjektet. TOF-prosjektet er et 3-årig ( ) kompetanseprosjekt for næringslivet (KPN) innen Petromaks 2 programmet. Prosjektet er finansiert av Forskningsrådet og 7 oljeselskaper, hvor Kystverket (v/ Rune Bergstrøm) sitter i Referansegruppen. TOF prosjektets målsetting er blant annet å generere ny kunnskap for effektiv og sikker håndtering/tiltak mot akutt forurensning med lette råoljer og kondensat, oljer som potensielt vil kunne gi stor utspredelse av tynne oljefilmer på sjøen. Det stilles også krav til dette fra Miljødirektoratet i forbindelse med utslippssøknader for oljeindustrien for denne typen oljer. I TOF prosjektet er tynne oljefilmer definert i området > 5 < µm. Et av delmålene i TOF prosjektet er å videreutvikle dagens oljespredningsmodell (OSCAR) til å kunne gi et mer realistisk spredningsbilde av utslipp av denne typen oljer. Videreutviklingen vil skje med basis i eksperimentelle laboratorieforsøk, og et godt spredningsbilde vil være et viktig grunnlag for å beregne effektivitet av tiltak. Uttesting av tiltakskonsepter for tynne oljefilmer har vært basert på mekanisk dispergering med "flushing" av vann via dysebom foran på baugen av beredskapsfartøy samt bruk av Fi-Fi vannkanoner. 2 Målsetting Den overordnede målsetting med spredningsstudiene har vært å generere relevante og robuste spredningsdata på rene oljer og blandinger av oljer med ulike reologiske egenskaper (dvs. viskositet og yield-stress). Oljer med ulik grad av såkalt ikke-newtonske egenskaper, altså evnen til å motstå gradvis deformasjon ved økning av skjærkraft, har blitt brukt. Yield-stress (Pa) er definert som den kraften som må overvinnes for at en olje fortsatt skal spres ved å flyte ut som en væske på sjøen, og kalles også flytegrense. Oljens flytegrense vil påvirke oljens utspredning på sjøen, og utbredelsen vil reduseres og etterhvert stoppe opp, hvorpå terminal filmtykkelse kan beregnes. Resultatene fra spredningsforsøkene utført på dieseloljene til Kystverket og fra forsøkene utført som en del av TOF prosjektet vil tilsammen danne et grunnlag for å videreutvikle og forbedre de eksisterende spredningsalgoritmene for modellering av filmtykkelse som brukes i dagens versjon av OSCAR. Dette vil i første omgang ikke føre til endringer i dagens OWM, ettersom "standard" OWM prediksjoner baserer sine forvitringsberegninger på å sette ulike terminaltykkelser for ulike kategorier av oljer (de eksisterende kategoriene er: destillat, lav-emulgerende råolje, emulgerende råolje, og tung bunkersolje). Generelt anses disse standardene som tilstrekkelig til våre forvitringsprediksjoner, og det er allerede mulig å velge andre terminaltykkelser enn de eksisterende standardene i OWM. Resultatene fra spredningsforsøkene vil på sikt kunne danne grunnlag for eventuelle justeringer av de standard terminaltykkelsene som benyttes i OMW i dag, samt videreutvikle en spredningsmodul i OMW som beregner filmtykkelse som funksjon av forvitringstid på sjøen. Spredningsforsøkene finansiert av TOF-prosjektet ble utført med "modelloljer som hadde et stort spenn i yieldstress (flytegrense). Dette for å fremskaffe et stort spenn innenfor de målbare resultater fra spredningsforsøkene. Disse modelloljene ble laget ved å blande WRG og et 250C o + residue av Norne-oljen i ulike blandingsforhold. Spredningsforsøkene med de to diesel-oljene (Farget GO SINTEF ID ) og WRG (SINTEF ID ). WRG og GO (rene dieseloljer, ikke blandinger) ble først og fremst utført for å dokumentere forskjeller i utspredningsegenskaper og terminal filmtykkelser mellom dieseloljer. Både MGO (500 ppm S) og den fargede GO (10 ppm S) hadde svært lave eller ingen yield-stress-verdier, og det ble derfor ansett som tilstrekkelig å bruke kun den ene (GO) for å representere denne typen diesel i disse spredningsforsøkene. Hensikten var å studere filmtykkelsen til de rene dieselene og blandingene under kontrollerbare forhold samt å måle yield stress (flytgrense) ved flere skjærhastigheter. Table 2-1 nedenfor oppsummerer egenskapene til MGO diesel, WRG og de ulike blandingene som ble brukt i alle spredningseksperimentene (finansiert gjennom TOF og KyV-Diesel-prosjektene). Dette, sammen med Page 21 of 306
22 metodikk for måling av Yield-stress (både vha. Oscillerende rheometer og bruk av Bingham fluid modeltilpassning) er nærmere beskrevet i Brönner et al., 2017 (in prep). Table 2-1 Egenskaper til de ulike oljene brukt i spredningseksperimentene Blend MGO diesel WRD Fraction of Norne 250 o C+ in WRD Norne % 10 % 20 % 30 % Density (kg/m 3 ) Yield Stress (N/m 2 ): Oscillating rheometer Bingham model fit (data hentet fra Brönner et al. 2017) 3 Eksperimentelt oppsett Metodikken som ble benyttet i disse spredningsforsøkene er utviklet av SINTEF gjennom TOF og Diesel Fase II prosjektene. Forsøkene er gjort i et plastikkbasseng (diameter: 550 cm, dybde: 85 cm) plassert i et temperaturregulert laboratorium. Alle forsøkene ble gjort ved 10 C (både luft og sjøvann), og en skjematisk skisse av forsøksoppsettet er vist i Figure 3-1. Det eksperimentelle oppsett er nærmere beskrevet i Leirvik, (2016) Forsøkene ble utført ved å pumpe en kjent mengde olje (4 L) gjennom en frekvenskontrollert pumpe ("Contoil" flowmeter-fortregningspumpe, Kracht), gjennom et rør til sentrum av bassenget og like under vannoverflaten. Testoljen ble i forkant kondisjonert til 10 C og rundpumpet for å sikre homogenitet og flytbarhet før injeksjon. Et traktformet utløp ble benyttet til påføringen for å redusere effekten av pumpehastigheten ved utløpet. Det ble benyttet en "flow rate" på 2 L/min. Utslippet (injeksjon) pågikk i 2 min. Oljens utspredning ble dokumentert, både under og etter injeksjon (inntil utspredningen har terminert, se Figure 3-2), ved hjelp av: Overhengende kamera (Prosilica, GX1660) Undervannskamera Filmtykkelse: Ultralyd-Transduser (plassert under vannoverflate) Supplerende Pad-prøver for gravimetrisk måling av oljefilmen etter stans av utslippet (dvs. veiing av mengde olje adsorbert på pad (Leirvik, 2016),. Page 22 of 306


23 550 cm 85 cm Figure 3-1 Skisse til metodeoppsett for spredningstesting Olje-injeksjon og videodokumentasjon. Figure 3-2 Eksempel på utslipp og spredning av olje i testbassenget under og etter utslipp. Målingene ble gjennomført etter terminering av utspredning (innen 2-3 min etter utslipp) GO-dieselen hadde for lys egenfarge, og ble tilsatt et ekstra fargestoff for å være synlig på vannoverflaten. Som en del av TOF-prosjektet ble det utført totalt 15 forsøk på kjente oljeblandinger (av råoljer med ulik reologi). For å supplere disse TOF-forsøkene med relevante dieseloljer med ulike reologiske egenskaper, ble det i tillegg, gjennom Diesel Fase II, utført forsøk med følgende oljer og oljeblandinger: Blanding av 20 % Norne og 80 % WRG (Wide Range Gas oil) Farget GO (SINTEF ID ) WRG (SINTEF ID ) Resultater med de sistnevnte forsøkene presenteres videre i dette notatet. Page 23 of 306
24 4 Resultater fra spredningsforsøkene Figure 4-1 oppsummerer resultatene av tykkelsesmålingene med undervanns-ultralyd transduceren for de tre forsøkene: Blanding av 20 % Norne og 80 % WRG (Wide Range Gas oil) Farget GO WRG Fotodokumentasjon som funksjon av tid for de ulike forsøkene er vist i vedlegg A-1, A-2 og A-3. Figure 4-1 Fordeling av filmtykkelse til WRG/Norne (80:20- lilla), WRG alene (rød) og farget GO (blå) etter endt forsøk Resultatene i Figure 4-1 viser målbare tykkelser (PAD og Ultralyd-målinger) ved avstander fra sentrum av filmen etter at utslippet og utspredningen var stoppet. Utspredningen av sheen, rainbow, metallic tas ikke med i disse målingene, da dette representerer en svært liten andel av oljen. Måleperioden for hvert forsøk ble derfor gjennomført ila. maksimum 2-5 min. etter at utslippet var stoppet. Innenfor denne perioden antas ikke at spredningegegenskapene vil påvirkes av forvitring. F.eks er fordampningen for GO beregnet til å være < 1-2% innenfor innen denne tidsperioden. Under disse utslippsbetingelser var det ingen nedblanding (dispergering) av oljedråpen. Blandingen med WRG og Norne (lilla) viser en tykkere film (terminaltykkelse) ved senter sammenlignet med WRG alene (rød) og GO (blå). Filmtykkelsen til blandingen blir langt tynnere ved relativ kort avstand fra sentrum. WRG testet alene hadde større filmtykkelse (terminaltykkelse) enn farget GO ved alle målte avstander fra sentrum, men WRG-dieselen spredde seg ikke ut over hele bassenget. Som bildene viser i vedlegg A-3, spredde GO (Farget) seg ut over bassenget i løpet av forsøket, noe som resulterte i en svært tynn oljefilm. Den kraftige fargen på bildene skyldes det tilsatte fargestoffet. Disse resultatene viser klare variasjoner i utspredningen mellom oljene. Ut fra disse forsøkene er det grunn til å forvente vesentlig forskjellige spredningsegenskaper og terminal filmtykkelse mellom WRG-oljen, som har en målt yield-stress-verdi på 0,2 Pa, i forhold til farget GO, som ikke har noen målbar yield-stress. Dette vil også gjelde ved reelle utslipp i felt hvor væsker med et yield stress på null/ingen målbare verdier, vil oppføre seg som Newtonske væsker og dermed, i teorien, ha uendelig spredning. Page 24 of 306
25 Oljer med høyere grad av ikke-newtonske egenskaper (begrenset spredning) og høyere yield-stress-verdier vil ha en vesentlig mindre utspredelse enn oljer med lavere grad av ikke-newtonske egenskaper og lavere yieldstress-verdier. For de presenterte resultatene for oljene og oljeblandingen vises dette for blandingen av WRG/Norne, som har en yield-stress verdi på 2,0 Pa, sammenlignet med WRG alene, hvor yield-stress-verdien var kun 0,2 Pa. WRG/Norne-blandingen hadde lavere utspredning enn WRG alene. 5 Oppsummering, og videre bruk av resultater i OSCAR Status pr. mars, 2017: Det presiseres at de verdiene som er målt og dokumentert gjennom disse bassengforsøkene er styrt av selve forsøksoppsettet, i tillegg til oljenes reologiske egenskaper. Resultatene kan derfor ikke overføres direkte til felt. Derimot har resultatene fra disse spredningsforsøkene tilsammen dannet et grunnlag for videreutvikling av eksisterende spredningsalgoritmemodul for modellering av filmtykkelse som brukes i dagens versjon av OSCAR. Dette arbeidet er beskrevet i en rapport (Johansen et al, 2017.) fra TOF-prosjektet. Ut fra denne rapporten jobbes det nå med en publikasjon til tidsskriftet Marine Pollution Bulletin (Brönner et al. 2017). Den nye spredningsmodellen er nå implementert i en intern versjon av OSCAR og under uttesting for å vurdere hvor godt modellen virker sammen med andre prosesser i OSCAR (naturlig dispergering, re-surfacing, forvitring o.l.). I de kommende uker vil denne versjonen i OSCAR bli brukt til å kjøre test-simuleringer av ulike utslippsscenarioer blant annet på de oljene som ble benyttet i de eksperimentelle spredningsforsøkene. Vi vil i denne sammenhengen ha en dialog med Kystverket i å sette opp noen enkle, men relevante utslippsscenarioer med de to diesel oljene (GO og WRG) i forkant av disse testsimuleringene. Ansvarlig for disse simuleringene hos SINTEF er Ute Brönner. 6 Referanser: Leirvik, Frode: 2016: Spreading experiments model oils". Prosjektmemo. Tynne Oljefilm (TOF)-prosjektet. Johansen, 2016: Surface_spreading_of_waxy_oils_ Technical Memo JEMC Memoet går inn I rapporten SINTEF Report F Upgraded oil spill modelling with OSCAR (201in prep.) Ute Brönner*, Øistein Johansen, Frode Leirvik, and Tor Nordam: 2017: Gravity spreading of waxy crude oils on calm water".paper in prep. For Marine Poll. Bulletin. * Corresponding author: ute.broenner@sintef.no Page 25 of 306
26 A Bilder fra spredningsforsøk Bildedokumentasjon fra spredningsforsøk med WRG/Norne-blanding Bilder fra det nevnte forsøket med 20 % Norne olje og 80 % WRG vises under, fra start til slutt med oppgitte tidsintervall. Utslipp av totalt 4 L olje over 2 min. Måle-perioden avsluttes innen 2-5 min etter utslipp (når utspredningen har stoppet). Start 10 s Page 26 of 306
27 20 s 30 s 40 s Page 27 of 306
28 50 s 60 s 120 s Page 28 of 306
29 Slutt (7 min) Page 29 of 306
30 Billed-dokumentasjon fra spredningsforsøk med ren WRG WRG: Et spredningsforsøk ble utført med WRG alene. Utslipp av totalt 4 L olje over 2 min. Bildene under viser spredning for det første minuttet (10 sek intervall), etter 2 min og ved avslutning av forsøket. (3 min etter utslipp (når utspredningen har stoppet). Start 10 s Page 30 of 306

31 20 s 30 s 40 s Page 31 of 306
32 50 s 60 s 120 s Page 32 of 306
33 Slutt (290 s) Page 33 of 306
34 Billed-dokumentasjon fra spredningsforsøk med farget Gassolje GO (Farget) Et spredningsforsøk ble utført med en ekstra godt farget prøve av GO-dieselen (10 ppm). Utslipp av totalt 4 L olje over 2 min. Måle-perioden ble avsluttes innen 5 min etter utslipp Start 10 s Page 34 of 306
35 20 s 30 s 40 s Page 35 of 306

36 50 s 60 s 120 s Page 36 of 306
37 180 s Slutt (7 min) Kommentar: Det siste bildet er svært mørkt. Pg.a fargetilsettingen i oljen, ser det visuelt se ut som om oljen var spredd over hele bassenget. Utspredni Page 37 of 306
38 SINTEF Ocean AS Postadresse: Postboks 4762 Torgard 7465 Trondheim Switchboard: Foretaksregister: NO MVA Prosjektnotat Renneforsøk med MGO og WRG Forsøk 1-5 VERSJON DATO FORFATTER(E) Kaja Cecilie Hellstrøm OPPDRAGSGIVER(E) Kystverket (Norwegian Coastal Administation) GRADERING Restricted OPPDRAGSGIVERS REF. Silje Berger ANTALL SIDER OG VEDLEGG: 38 med vedlegg SAMMENDRAG 5 renneforsøk er gjennomført med de marine dieseloljene MGO og WRG, og resultater fra disse forsøkene er presentert i dette notatet. Tre forsøk ble utført med WRG, et med varierende energiinnstillinger, og to forsøk med standard energiinnstillinger, men med ulike temperaturer. PROSJEKTLEDER Kaja Cecilie Hellstrøm GODKJENT AV Mimmi Throne-Holst Dette memoet inngår i rapport OC2017 A-123 Page 38 of 306
39 Innholdsfortegnelse 1 Wide Range Gas oil, 13 C, trinnvis energi Standard forsøk, WRG, 13 C Bilder fra forsøk Resultater sammenlignet med prediksjoner Marine Gas Oil (MGO, 500 ppm S), 13 C Bilder fra forsøk Resultater fra renna i forhold til prediksjoner Marine Gas Oil (MGO, 500 ppm S), 2 C Bilder fra renneforsøk Resultater fra renneforsøket sammenlignet med prediksjoner Wide Range Gas oil, 2 C Bilder fra forsøk Sammenligning av resultater fra renna med prediksjoner Konklusjoner Referanser Page 39 of 306
40 Tabell 6-1: Oversikt over de utførte forsøkene med informasjon rundt energiinnstillinger, Parameter Renneforsøk nr SINTEF-ID Oljetype Wide range gas oil Wide range gas oil MGO 500 ppm S MGO 500 ppm S Wide Range Gas oil Uke/år 50/15 51/15 1/16 6/16 7/16 Energi-innstillinger Lav-Lav IIstandard Standard Standard Standard Standard Temperatur 13 C 13 C 13 C 2 C 2 C Simulert sollys Ja Ja Ja Nei Nei Silhuettkamera Nei Ja Nei Ja Ja Varighet fra start til før dispergering 48 t 72 t 72 t 72 t 72 t Dispergeringsmiddel Dasic NS Dasic NS Dasic NS Dasic NS Dasic NS/Corexit 9500 Dosering (g) 56, (= 66) 23 14,8 14,4 + 25,8 + 46,7 + 58,5 Dosering (DOR %) 0,99 0,58 + 0,39 (= 0,97) 0,87 0,39 0,24 + 0,43 + 0,78 + 0,98 Dosering (DOR) 1:100 3: :250 = 1: : :130 (=7:500) )+1:100 1:115 1:250 1:100 (=1:40) Dosering (DER, %)* 0,99** 0,17 + 0,11 (= 0,28) 0,87 0,39 0,06 + 0,11+ 0,20 + 0,25 DER 1:500 1: :900 = 1:135 1:360 1:250 1: : :500 +1:400 (=1:160) Antall påføringer Godt dispergert etter siste Ja dispergering? Ja Ja Begrenset Nei *: basert på ubrutt emulsjon om ikke annet er nevnt **: basert på brutt emulsjon Standard innstillinger i meso-skala renne er tilpasset for å simulere en vindhastighet tilsvarende en vindhastighet på 5-10 m/s, og dermed forhold med brytende bølger. Page 40 of 306
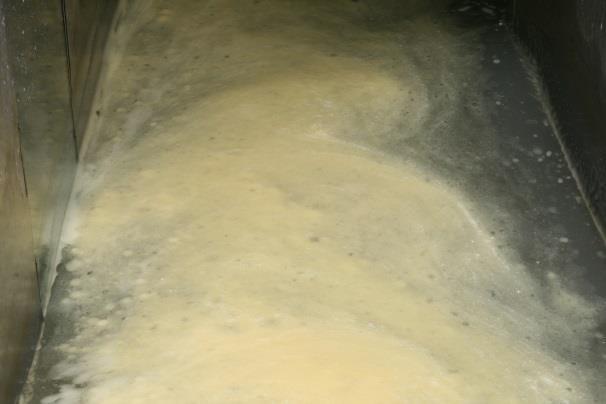
41 1 Wide Range Gas oil, 13 C, trinnvis energi Et innledende forsøk ble utført i uke 50 i 2015, og Wide Range Gas oil (WRG, ) ble benyttet da denne hadde vist emulgerende egenskaper i tidligere utført emulsjonstesting. Det ble besluttet å gjøre en trinnvis oppjustering av energiinnstillingene underveis i forsøket for å undersøke hvilke forhold som måtte til før eventuell emulgering oppsto. Tabell 1-1 under oppgir hvilke energinivå som ble benyttet ved de forskjellige tidspunktene i forsøket og hvilke bølgeforhold dette tilsvarer samt de benyttede innstillingene for bølgemaskinen. Tabell 1-1: Oversikt over benyttede energinivå for bølgeinnstilling under forsøket og bølgetypene disse tilsvarer Tid fra start Sum timer Energinivå Tilsvarende bølgetype Innstillinger cm Frekvens 0-4 t 4 Lav I Dønninger t 20 Lav II Ikke-brytende bølger Standard Brytende bølger Energinivå: Lav I, 0-4 t Under energinivået Lav I lå dieselen jevnt på overflaten, men noe ble virvlet ned i vannet av den lave energien nær bølgegeneratoren. Bildet under viser virvelen som oppstod og antyder hvordan større dråper av WRG ble dannet. Disse dråpene steg raskt til overflaten og det ble ikke registrert emulgering. Bildet ble tatt gjennom glassruten nærmest bølgegeneratoren og refleksjoner fra sollyslampa er tydelig som hvite felt i bildet. Figur 1-1: Viser nedblanding av WRG ved energiinnstilling Lav I Energinivå: Lav II, 4-24 t Energien ble justert opp ca. 4 timer etter oppstart av forsøket. Dette skapte en noe større strøm/turbulens ved bølgegeneratoren, men det oppstod ikke brytende bølger. Figur 1-2 viser i bildet til venstre hvordan nedblanding av WRG økte som følge av den høyere energien. Langt flere dråper av ulik størrelse ble blandet lenger ned i vannet. Figuren viser også undersiden av dieselfilmen i renna i bildet til høyre, tatt nedenfra og opp fra sollyssiden kort tid etter endringer av energiinnstillinger. Dråpene som hadde blitt blandet ned i vannet, for så å stige opp igjen, la seg under selve overflatefilmen, men "smeltet" ikke sammen med denne. Dette førte til dannelse av en perleformasjon på undersiden av oljefilmen. Page 41 of 306


42 Figur 1-2: Viser nedblanding av WRG under energiinnstilling Lav II til venstre (ved sving nær bølgegenerator) og undersiden av dieselfilmen på langsiden. Dråper som har blitt blandet ned, men steget til overflaten igjen danner en perleformasjon under overflaten. Ved Lav II energiinnstillinger (tilsvarende dønninger) hadde WRG-oljen på overflaten endret karakter: Den var blitt litt blakket, noe som indikerte et lavt opptak av vann, men oljen hadde ikke oppnådd den samme gulhvite emulsjonen som ble observert under emulsjonstestingen utført ved benkeskala forvitring i forprosjektet. Energinivå: Standard, 24-48t Ved oppjusteringen til standard energi (brytende bølger) ble det observert umiddelbare endringer i oljen på overflaten og i nedblandingen av WRG i vannet. I løpet av de første ti minuttene endret overflateemulsjonen farge og ble lysere på grunn av økt vannopptak. Bildet øverst til venstre i Figur 1-3 på neste side er tatt fra samme posisjon ved bølgegeneratoren som tidligere og viser den økte nedblandingsenergien etter at Standard innstillinger ble benyttet. Bildet øverst til høyre i samme figur viser undersiden av emulsjonen, tatt fra sollyssiden av renna, og viser at emulsjonen som dannes har en ujevn, boblete underside. Ved denne energiinstillingen ble det dannet store dråper av emulsjon og også større vanndråper omringet av oljefilm. En større versjon av en slik vanndråpe omringet av oljefilm er vist nederst til venstre i Figur 1-3, og er estimert til å være ca. 2-3 cm på det bredeste. I tillegg viser figuren emulsjonen sett fra oversiden ved sollyslampa. Den ujevne strukturen på undersiden av emulsjonen gjenspeiles ikke på overfalten. Ved prøvetaking av oljefasen under Lav I og Lav II innstillingene brøt denne helt før måling av vanninnhold kunne måles. Etter oppjustering av energinivået ble det dannet mer stabile emulsjoner, og vanninnholdet av disse kunne måles. Page 42 of 306


 på ca. 1:500 og DOR på 1:100.")
43 Figur 1-3: Bildet øverst til venstre viser nedblanding av WRG ved sving nær bølgegenerator under energiinnstilling standard. Øverst til høyre viser undersiden av emulsjonen. Nede til venstre vises en stør vanndråpe omkranset av olje/emulsjon dårlig oppdrift indikerte at dette ikke var ren olje/emulsjon. Bildet nede til høyre viser overflaten av emulsjonen Etter 24 timer ved Standard energi hadde emulsjonen blitt lysere i fargen, og det var ikke mulig å sjeldne nedvirvlingen ved bølgegeneratoren på grunn av blakket vann. Den gjenværende dieselemulsjonen ble dispergert ved bruk av Dasic NS ved et doseringsforhold (dispergeringsmiddel:emulsjon, DER) på ca. 1:500 og DOR på 1:100. I Figur 1-4 sammenlignes bilder tatt fra samme posisjon emulsjonen før og etter dispergering. Som en følge av kjemisk dispergering ble emulsjonen i stor grad fjernet fra overflaten, og dråpene som ble virvlet ned i vannet ble også betydelig mindre. Page 43 of 306

44 Emulsjon på overflaten før dispergering (72 timer etter start) Dråper før dispergering Emulsjon på overflaten etter dispergering ( timer) Dråper etter dispergering Figur 1-4: Bildene demonstrerer effektiviteten av påføring av kjemisk dispergeringsmiddel. Øverst: emulsjon og dråpestørrelse før dispergering. Nederst: overflate og vannfase etter dispergering. Etter dispergering ble det generert oljedråper med langt mindre dråpestørrelse, i < 100 µm området i motsetning til dråpene før dispergering som var opp mot 5 mm i diameter. Større dråper med lav oppdrift ble observert, men regnes som vanndråper med en film av olje rundt, og ikke som oljedråper. Tabell 1-2 viser de målte egenskapene til WRG-oljen under renneforsøket, og oppgir også benyttet DOR ved dispergering. Vanninnholdet som oppgis ble målt på gjenværende oljefilm etter at emulsjonen var brutt for Lav I og Lav II innstilligene, og vanninnhold i emulsjon for Standard energiinnstillinger. Både WRG-oljen og emulsjonen som ble dannet hadde lave viskositeter, og emulsjonen som dannet seg ved Standard energiinnstillinger var lite stabil og brøt raskt. Page 44 of 306
45 Tabell 1-2: Oversikt over målte egenskaper for WRG under forsøket Prøvenumme Tid Vanninnhold Fordampet Viskositet (mpa s), Diesel i vann, r (timer) (volum %) (vekt %) 10 s -1 ppm 1 1 0,09* 0, ,05* 0, ,04* 0, ,04* 0, ,07* 0, ,10* 0, ** 0, ** 0, ** 0, ** 0, st påføring av dispergeringsmiddel: 56,8 g Dasic NS (DOR = 1:100) 3 min etter disp min etter disp min etter disp min etter disp *Vanninnhold i oljefase **Vanninnhold i emulsjon Figur 1-5 under viser massebalansen for forsøket samt effekten av dispergering. Forandringene i bølgeenergi ble utført etter 4 timer, fra Lav I til Lav II, og etter 24 timer, Lav II til Standard. Massebalansen reflekterer endringene i energi med svak økning i naturlig dispergert olje etter fire timer, og en ny økning i naturlig dispergert olje mellom 24 og 48 timer. Påføring av dispergeringsmiddel resulterte i tilnærmet fullstendig dispersjon av den gjenværende oljen på overflaten. Det ble gjennomført en påføring med standard mengde dispergeringsmiddel (ca. 60 g, DOR = 1:100). Effekten inntraff i løpet av de første 10 min etter påføring og det var ikke store forskjeller mellom denne prøven og prøven som ble tatt 60 min etter påføring. Page 45 of 306

46 Figur 1-5: Massebalanse for forsøk 1, WRG 13 C, før dispergering. Dispergering ble igangsatt 48 timer etter oppstart. Noe olje/emulsjon festet seg til veggen i renna, og dette er merket som adsorbert i figuren. Figur 1-6: Effekt av dispergeringsmiddel under forsøk 1, WRG 13 C. Dispergering ble igangsatt ca. 48 timer etter start av forsøket og resultatene viste økt dispergering ved etter påføring av kjemisk dispergeringsmiddel. Page 46 of 306
47 2 Standard forsøk, WRG, 13 C WRG er en dieseltype det er begrenset med forvitringsinformasjon om, og dette forsøket ble utført som et standardisert renneforsøk. Standard renneforsøk benyttes ofte på råoljer og har de samme energiinnstillingene som ble benyttet som høyeste energi i det første renneforsøket på dieselen (se kapittel 1). Ved å starte med denne energiinnstillingen var målet å se om den gulhvite emulsjonen som ble observert i det første forsøket også oppstod umiddelbart ved høyere energiinnstillinger. I tillegg ga forsøket informasjon om levetiden til dieselen ettersom den ble testet ved høyere energi i 3 døgn, før dispergering av den gjenværende dieselemulsjon. Dispergering ble utført med lavere dosering enn i Forsøk 1 ettersom effektiviteten av dispergeringsmiddelet var høy under det innledende forsøket. En lavere dosering ble derfor valg for å finne en lavere grense for bruk av dispergeringsmiddel. Et silhuettkamera ble testet i renna for å sjekke om dråpestørrelsesfordelingen i vannet kunne undersøkes gjennom forsøket. Ved oppstart dannet det seg raskt en gulhvit emulsjon som virket luftig og nesten som skum. Denne lignet mye på den samme emulsjonen som ble dannet under det første renneforsøket da energien ble skrudd opp til standardnivå. Det var store dråper på mellom 2-7 mm i vannet, og i tillegg større, oljedekkede vanndråper med lav oppdrift, og prøvene som ble tatt av emulsjonen viste at denne var ustabil og brøt raskt. Etter det første døgnet var emulsjonen blitt gulere og tykkere, og det var færre synlige oljedråper i vannfasen samtidig som vannet virket mer misfarget enn tidligere. Etter 48 timer hadde emulsjonen blitt mer stabil og dannet et tykkere lag på 1,5-2 cm på "sol-siden" av renna, hvor overflateforholdene var roligere. Etter tre døgn hadde fargen til emulsjonen mørknet til en mer oransje farge, og det var tilsynelatende mindre emulsjon på overflaten en dagen før. En reduksjon i volum av emulsjonen tydet på en endring i vanninnhold over tid eller en høyere grad av naturlig dispergert olje. Tabell 2-1 viser at vanninnholdet i emulsjonen gikk opp til 80 vol. % etter 24 timer, men sank til 71 vol. % etter 73 timer (tre døgn). Dette kan ha bidratt til observasjonen av mindre emulsjon på overflaten. En svak økning av naturlig dispergert olje ble også funnet mellom 48 og 72 timer. Dispergeringsmiddel ble påført i to omganger ettersom det ikke ble oppnådd fullstendig dispergering ved førstegangs forsøk. Den totale doseringen av dispergeringsmiddel (omgang 1 + 2) var liknende den som ble benyttet i det innledende forsøket (DOR = 1:100). Påføring av dispergeringsmiddel viste god effektivitet, og det ble besluttet å la forsøket gå videre over to timer for å se om effekten var vedvarende. To timer etter andre påføring av dispergeringsmiddel ble det visuelt vurdert til å være ca. 5 % av opprinnelig emulsjonsmengde igjen. Tabell 2-1 viser de målte egenskapene til emulsjonen gjennom forsøket samt de målte verdiene for nedblandet dieselolje. Ved begge påføringene av dispergeringsmiddel ble det benyttet doseringer lavere enn standard (60 g, DOR = 1:150), i forsøk på å finne den lavest nødvendige doseringen. Det ble observert økt graden av nedblandet olje etter den andre dispergeringen, noe som kan skyldes den totalt høyere doseringen av dispergeringsmiddel (totalt 1:100 DOR). Dette vises i Figur 2-2, hvor prosentandelen dispergert olje har økt fra 43% til 60 % mellom første og andre runde med dispergering. Økningen i dispergerbarhet kan også skyldes endringer i emulsjonens egenskaper etter førstegangs påføring. For emulsjoner av enkelte råolje er det tidligere observert en reduksjon i viskositet og vanninnhold i emulsjonen etter en påføring av dispergeringsmiddel, uten at dispergerbarheten har økt. Disse endringene har likevel bidratt til økt effektivitet ved andregangs påføring av dispergeringsmiddel. Tilsvarende effekt kan være gjeldende for WRG, men nødvendige analyser av emulsjonen etter påføring ble dessverre ikke gjennomført for å sjekke dette. Benkeskala doseringstesting viste bedre effektivitet ved høyere doseringer enn lave for WRG-oljen. En høyere dosering av dispergeringsmiddel anbefales derfor, f. eks. bruk av DOR = 1:100, 1 vekt %, eller høyere per påføring. Page 47 of 306
48 Tabell 2-1: Oversikt over målte parametere og egenskaper under forsøk 2 Prøvenummer Tid Vanninnhold Fordampningsgrad Viskositet Diesel i vann, (timer) (volum %) (vekt %) (mpa s) 10 s -1 ppm 1 0,5 67 0, , , , , , , , påføring av dispergeringsmiddel: 39,7 g Dasic NS (DOR =3:500, DER =1:600) 3 min. disp min. disp min. disp min. disp påføring av dispergeringsmiddel: 26,7 g Dasic NS (DOR = 1:250, DER =1:900) 3 min. disp min. disp min. disp min. disp Totalt påført dispergeringsmiddel: 66,4 g Dasic NS (DOR 1:100, DER 1:360, wt:vol) Massebalansen for de første 72 timene av forsøket er vist i Figur 2-1 under og er basert på resultater fra målinger underveis i renna. I tillegg vises effekten av dispergering i et eget stolpediagram i Figur 2-2. Mengden dispergert olje er basert på kvantifisering på GC og figurene viser et resultat som avviker fra de visuelle observasjonene som gjort under forsøket. De målte resultatene indikerer at det 2 timer etter andre og siste påføring av Dasic NS var igjen i underkant av 40 % av emulsjonen på overflaten, mens estimatet basert på observasjoner var at ca. 5% av emulsjonen lå igjen på overflaten. Dette avviket kan skyldes at oppdriften til oljen forårsaker variasjoner i vannsøylen, og at nedblandet olje ikke befant seg i det vannlaget der prøvene ble tatt fra. Prøvepunktet for vannprøvene som benyttes er plassert i svingen før bølgemaskinen, cirka midt i vannsøylen (ca. 50 cm under overflaten). Ettersom store dråper har en raskere stigningshastighet enn mindre dråper samtidig som de utgjør hoved-andelen av oljevolumet, vil fravær av disse fra vannprøven påvirke resultatene. Observasjonene som er gjort underveis i forsøket er generelle og vurderer kun det som er synlig på overflaten. Det vil derfor kunne oppstå et avvik mellom disse dersom nedblandet diesel i større grad befinner seg høyere opp i vannsøylen enn prøvepunktet, men likevel ikke rekker å nå overflaten før bølgemaskinen forårsaker ny nedblanding. Mangelen på olje som når overflaten indikerer at dieseloljen har en høyere nedblanding enn det som er målt. I en reel forurensningssituasjon vil både kontinuerlig fortynning og høyere bølgefrekvens bidra til stadig nedblandingen, og dette er faktorer som renneforsøket ikke tar høyde for. Page 48 of 306

49 Figur 2-1: Massebalanse for forsøk 2 Figur 2-2: Effekt av dispergeringsmiddel, forsøk 2 Page 49 of 306


50 2.1 Bilder fra forsøk 2 Bildeserien viser utviklingen underveis i renneforsøket, med store dråper innledningsvis, emulsjonsdannelse etter 24 timer, og effekt av kjemisk dispergering. 30 min etter start 2 timer etter start 4 timer etter start 24 timer etter start Page 50 of 306


51 48 timer etter start 72 timer etter start 10 min etter dispergering # 1 2 timer etter dispergering #2 Page 51 of 306


52 2.2 Resultater sammenlignet med prediksjoner Målte verdier av vanninnhold i emulsjonen og emulsjonsviskositet er vist i Figur 2-3. Både det målte vanninnholdet og viskositetene til WRG-oljen er sammenlignbare med prediksjonene, med renneresultater noe høyere for enkelte punkter. Det totale vannopptaket har vært begrenset til 70 % i prediksjonene, men det ble observert et noe høyere vanninnhold under renneforsøket. Det høyere vanninnholdet forårsaker også trolig de noe høyere målte viskositetsverdiene i renneforsøket, sammenlignet med prediksjonene. Figur 2-3: Resultater fra renneforsøkt sammenlignet med modellerte egenskaper Page 52 of 306
53 3 Marine Gas Oil (MGO, 500 ppm S), 13 C Et standardisert forsøk ved 13 C ble utført på MGO 500 ppm S ( ) i første uke av januar Som for WRG beskrevet over, var målet å se på om dieselen hadde emulgerende egenskaper over tid, med de samme parameterne som ved Forsøk 2. Dieselen viste noe evne til å inkorporere vann i dieseloljen i renna, og dannet en løs, ustabil blanding (videre omtalt som emulsjon). Dette var i motsetning til hva som ble observert ved emulsjonstesting i benkeskala. Det må poengteres at dieseloljen ikke danner en tradisjonell emulsjon, men danner en ustabil olje/vann-blanding der vannet raskt skilles fra oljefasen ved stillstand. Fingas og Fieldhouse (2004) benytter fire kategorier for å klassifisere vann-i-olje-blandinger; stabile, mesostabile, inkorporert vann (entrained water) og ustabile emulsjoner. Av disse faller emulsjoner av dieseloljer hovedsakelig under ustabile emulsjoner, og denne betegnelsen benyttes. Det ble ikke observert dråper med vann omringet av olje. Emulsjonen som oppstod brøt i løpet av kort tid etter prøvetaking, men var stabil nok til å utføre viskositetsmålinger. Viskositetene som ble målt på MGO-emulsjonen var lave, mellom 6-14 mpa s. Til sammenligning WRG-emulsjoner (Forsøk 1+2) målt til å ha viskositet opp mot mpa s. Etter 3 døgn i renna var det ennå noe emulsjon igjen, og denne ble dispergert med en lav dosering (DER:1:135) av dispergeringsmiddel. Tabell 3-1 summerer opp noen av de målte egenskapene til dieselen. Mengden diesel blandet ned i vannet ble kvantifisert basert på GC. Prøven som ble tatt etter 2 timer viser langt høyere mengde dispergert diesel enn ved 1 og 4 timer, noe som også gjenspeiles i massebalansen i Figur 3-1. Dette skyldes trolig en lite representativ prøve hvor noen få større dråper med diesel har fulgt med ved prøvetaking og dermed ført til høyere målte oljekonsentrasjoner. Dieselen var lys gul (dog blålig på bildene), og dannet en perleaktig, glitrende struktur på vannoverflaten ved påføring. Fargen ble gradvis mørkere og dannet løs emulsjon i løpet av de første 2 timene. Volumet av emulsjonen økte noe samtidig som fargen ble mørkere gul. Store dråper (ca. 5 mm i diameter) ble observert i vannfasen etter 24 timer. Emulsjonen var ustabil og brøt i løpet av 10 minutter og oljefasen var vannfri etter at emulsjonen brøt. Ingen store endringer ble observert mellom 24 og 72 timer, annet enn at fargen ble noe mørkere. Dispergering virket effektivt: det var ikke mulig å se større dråper i vannfasen og det dannet seg kun "fettperler" på overflaten. Tabell 3-1 viser egenskapene til emulsjonen og mengden nedblandet olje under forsøket mens Figur 3-2 viser dispergerbarhet basert på vannanalyser, og begge speiler observert effektivitet av dispergeringen. Tabell 3-1: Målte parametere under forsøk 3 Prøvenummer Tid Vanninnhold Fordampningsgrad Viskositet Diesel i vann, (timer) (volum %) (vekt %) (mpa s), 10 s -1 ppm* 1 0, ** st påføring av dispergeringsmiddel: 23 g Dasic NS (DOR =1:115, DER =1:135, wt:vol) 3 min etter disp min etter disp min etter disp min etter disp * kvantifisert ved GC-MS ** mulig ikke-representativ prøve Beregnet massebalanse er vist i Figur 3-1, og viser at dieselen dispergerer naturlig mer over tid samtidig som lettere komponenter fordamper. I en reel situasjon vil trolig dieselen dispergere raskere, ettersom energitilførselen vil skje mer regelmessig og det er en konstant fortynning av den dispergerte dieselen. I renna vil dråper av diesel som dannes og dispergeres av den brytende bølgen, få nok tid til å flyte opp til overflaten Page 53 of 306


54 igjen før en ny brytende bølge gjentar prosessen. Massebalansen kan derfor gi et konservativt inntrykk av hva som vil skje ved en reel hendelse. Det ville vært gunstig å se på dråpestørrelsesfordelingen av de dispergerte dråpene i tillegg til den totale mengden dispergert diesel, for å beregne hvor stor andel av dieselen som vil stige hurtig til overflaten. Dessverre ble ikke Silhuettkameraet benyttet i forsøket, da tidligere forsøk på bruk av dette kameraet ikke var vellykket. Figur 3-2 viser hvordan dieselen dispergerer etter påføring av dispergeringsmiddel. Som figuren viser ble dieselen totalt dispergert i løpet av en halvtime etter påføring. Doseringen av dispergeringsmiddel var lav, DOR (vekt til volum) = 1:115. Figur 3-1: Massebalansen for MGO, forsøk 3 Figur 3-2: Dispergerbarhet under forsøk 3 Page 54 of 306


55 3.1 Bilder fra forsøk 3 Den følgende bildeserien er tatt under renneforsøket med MGO og viser den løse emulsjonen som ble dannet over tid. Effektiviteten av kjemisk dispergering vises også. 30 min 2 timer 6 timer 24 t Page 55 of 306


56 48 t 72 t 3 min etter dispergering 30 min etter dispergering Page 56 of 306


57 3.2 Resultater fra renna i forhold til prediksjoner Figur 3-3 viser resultater fra renneforsøket sammenlignet med prediksjoner av de samme egenskapene. De predikerte verdiene for viskositet og fordampning stemmer godt overens med de målte resultatene fra renneforsøket. Figur 3-3: Resultater fra renneforsøk #3 sammenlignet med prediksjoner for dieselen Page 57 of 306
58 Figur 3-4: Vannopptak for MGO 13 C. Figur 3-4 viser predikert vannopptak basert på benkeskala data sammenlignet med målte verdier fra renneforsøket. Prøvene som ligger til grunn for renneresultatene er tatt ved "Plankemetoden", en metode som skal forhindre at emulsjonen bryter før prøvetaking. Denne metoden avviker fra den vanlige prøvetakingen hvor emulsjonen får skille ut overflødig vann før prøvetaking. Metoden ble benyttet for å bedre bevare den emulsjonen som ble dannet i renneforsøket da denne avvik fra resultater fra emulsjonstestingen. Det ble vurdert som viktig å hente informasjon om potensielt vanninnhold, selv om emulsjonen var løs og ustabil. De høye resultatene for vanninnhold de siste tre dagene viser derfor vanninnholdet til en svært ustabil emulsjon. Hadde emulsjonen stabilisert seg i trakt før prøvetaking vil trolig vanninnholdet ha krøpet den til < 10 vol. %. Page 58 of 306
59 4 Marine Gas Oil (MGO, 500 ppm S), 2 C Basert på resultatene for renneforsøket på MGO 500 ppm S ( ) ved 13 C ble det foreslått å utføre et tilsvarende standardisert renneforsøk under kaldere temperatur, 2 C, med den samme dieselen som i forsøk 3. Som for de øvrige diesel-oljene ble vannprøver ekstrahert og mengden olje i vann kvantifisert ved bruk av GC. Dieselen viste noe emulgerende egenskaper også ved 2 C, men det tok lengre tid før emulsjonen ble dannet. Visuelt oppførte dieselen seg forholdsvis likt som i Forsøk 3 med blank gul farge, og den la seg som perler på vannoverflaten også under dette forsøket. Dannelse av skumliknende, løs emulsjon (bestående av vann og olje) ble observert etter en halv time, og mengden skum bygget seg sakte opp over de første timene. Etter 6 timer på overflaten virket det som det er mindre olje på overflaten. Etter et døgn på overflaten hadde det dannet seg en løs emulsjon med store vanndråper innkapslet i skummet, og skummet var noe mer stabilt en den foregående dagen. Etter 48 timer på overflaten var det lite synlig olje på overflaten, og det som var tilgjengelig ble rapportert til å ha hatt en seig og ubehagelig konsistens. Sammenlignet med forsøket utført ved 13 C var det betydelig mindre emulsjon på overflaten ved 2 C enn ved 13 C etter 48 timer. Etter tre døgn (72 timer) var oljemengden tilgjengelig på overflaten for lav til å utføre prøvetaking normalt og bølgegeneratoren ble stoppet med dette formålet. Det ble påført en runde med dispergeringsmiddel med en lav dosering (DOR) på 1:250, og denne hadde tilsynelatende god effekt. Screeningen og doseringstestingen som ble utført i benkeskala viste god dispergerbarhet ved bruk av dispergeringsmiddel, selv for de lavere DOR. Et silhuett-kameraet ble benyttet til å forsøksvis måle dråpestørrelsesfordelingen underveis i forsøket, og både før og etter dispergering. Dessverre var det ikke mulig å hente ut pålitelige resultater da kameralinsene raskt ble dekket av et oljelag som forpurret bildekvaliteten og gjorde kvalifisering og kvantifisering av dråpene umulig. Tabell 4-1 viser målte resultater for MGO under renneforsøket. Tabell 4-1: Målte egenskaper og parametere under forsøk 4 Prøvenummer Tid (timer) Vanninnhold Fordampningsgrad Viskositet, 2 C Diesel i vann (volum %)* (vekt %) (mpa s) 10 s -1 ppm* 1 0, st påføring av dispergeringsmiddel: 14,8 g Dasic NS (DOR =1:250) (DER = 1:250, wt:vol) 3 min etter disp min etter disp min etter disp min etter disp min etter disp *vanninnholdet er basert på prøver tatt med traktmetoden som gir en prøve av brutt emulsjon Resultatene fra kvantifiseringen med GC viste lavere nivå av nedblandet olje etter 48 timer sammenlignet med resultatene etter 24 timer, og dette stemmer ikke overens med observasjonene som ble gjort underveis i forsøket. Dette kan skyldes at oljedråper som blandes ned i vannet varierer i størrelse over tid, og at representative mengder var ikke tilgjengelige i det vannlaget hvor prøvene ble tappet fra på grunn av varierende oppdrift til oljedråpene. Avviket mellom observasjonene og målingene kan tyde på at dieseloljen hovedsakelig befinner seg et sted mellom overflaten og prøvetakingspunktet under siste del av forsøket. På grunn av disse usikkerheten regnes observasjonene som ble gjort som de mest pålitelige resultatene. På de neste sidene er det presentert en rekke bilder fra forsøket. Page 59 of 306


60 4.1 Bilder fra renneforsøk 4 Bildeserien som følge viser MGO fra renneforsøket utført ved 2 C. Sammenlignet med bildene fra renneforsøket ved 13 C og samme diesel, dannes emulsjonen langt senere. P0: Påføring av diesel med kanne og diesel på vann rett etter påføring P0 + 5 minutter: oljedråper i vannfasen rett etter brytende bølge Page 60 of 306


61 P1, 30 minutt: Skumdannelse. Oljen er klar og ligger jevnt fordelt på overflaten. P2, 1 time: P5, 6 timer: Relativt små endringer de første timene. Det dannes mer skum og det ser ut som mer av oljen blandes ned i vannet. P6, 24 timer: Mindre olje på overflaten. Den løse emulsjonen har også blitt noe mer stabil men er fremdeles likevel veldig ustabil. Når den samles opp er emulsjonen blakket gul/brun (bilde under). Page 61 of 306

 P7, 48 timer: lite")


62 P6, 24 timer: oppsamlet emulsjon i skilletrakt. (Den lange lysveien øverst i skilletrakta får den til å se mørkere ut) P7, 48 timer: lite olje igjen på overflaten. Oljen ligger som "perler" på vannflaten. Når den samles opp har "emulsjonen" mer slimete konsistens. Brutt emulsjon (henstand på benk) er brun/gul i farge og helt vannfri. P8, 72 timer: Veldig lite olje igjen på overflaten. Bildet av skilletrakten viser emulsjonen før den bryter. Page 62 of 306


63 Dispergering: Før dispergering: stede. Oppsamlet olje ovenfra og fra siden. "emulsjonen" bryter når bølgeenergien ikke er til 30 sekunder etter påføring: emulsjonen brytes ned til små dråper. 3 minutter etter dispergering Page 63 of 306


64 20 minutter etter dispergering 2 timer etter dispergering: tilnærmet 100% observert dispergert. Ingenting på overflaten og ingenting på veggene. 4.2 Resultater fra renneforsøket sammenlignet med prediksjoner Figur 4-1 viser samsvar mellom predikerte verdier for MGO fra OWM og de målte verdiene fra renneforsøket utført ved 2 C. Både verdier for emulsjonsviskositet og fordampning er vist i figuren. I motsetning til prøvene som ble tatt under rennforsøket ved 13 C, ble emulsjonsprøvene tatt med traktmetoden for dette forsøket. Variasjonen i prøvetagingsmetode skyldes primært bytte av personell. Denne metoden for prøvetaking førte til at emulsjonen har brøt helt før prøven ble tatt. Etter som dette tok svært kort tid viser dette at emulsjonen som ble dannet var svært lite stabil. Fra et operasjonelt standpunkt regnes dieseloljen å ha svært lite emulgerende egenskaper, og den benyttede prøvetakingen gjenspeiler trolig bedre hvordan oljen vil være ved håndtering i et reelt scenario. Page 64 of 306

65 Figur 4-1: Målte verdier for fordampning og viskositet til emulsjonen fra renneforsøket vist sammen med prediksjoner for tilsvarende temperaturforhold Page 65 of 306

66 Figur 4-2: Vanninnholdet målt i emulsjonen under renneforsøket vist sammen med predikert vanninnhold Page 66 of 306
67 5 Wide Range Gas oil, 2 C Et standardisert renneforsøk ble utført med Wide Range Gas-oljen ved 2 C i uke 7, Silhuett-kameraet ble benyttet til å forsøksvis måle dråpestørrelsesfordelingen underveis i forsøket, og før og etter dispergering, men gav dessverre ikke anvendbare resultater grunnet tilgriset linse. Dannelsen av den skum-lignende emulsjonen skjedde ikke like umiddelbart som under forsøket med standard innstillinger ved 13 C (Forsøk 2), men var påbegynt etter 10 minutter. Emulsjonen som ble dannet etter 30 minutter brøt ikke fullstendig etter prøvetaking, og hadde derfor en viss stabilitet. I løpet av de første 72 timene ble observert at emulsjonen i større grad samlet seg og virket tykkere. Etter tre døgn dekket emulsjonen halve overflaten av renna. Prøvene som ble tatt av emulsjonen etter 48 og 72 timer ble oppfattet som mindre stabile enn prøver tatt tidligere i forsøket. Førstegangs påføring av dispergeringsmiddel hadde begrenset effekt, og det ble gjennomført en ny påføring av dispergeringsmiddel. Heller ikke denne ga den ønskede effekten, men emulsjonen endret karakter fra å være lys gul til å bli hvit og ha en fløteaktig konsistens. En tredje påføring med Dasic NS ble gjennomført uten betydelige endringer. Ved 4. gangs påføring ble det benyttet Corexit 9500 i stedet for Dasic NS, og dette ga en bedre effekt. Dråper som var synlige i vannfasen ble mindre og blakket vannet der dråpene oppholdt seg, og emulsjonen festet seg i større grad til veggene i renna. Det var fortsatt mye emulsjon igjen på overflaten da forsøket ble avsluttet. Det ble benyttet svært lave dose-til-emulsjon ratio (DER) ved påføring av dispergeringsmiddel, mellom 1:1660 og 1:400. Den lave doseringen ble benyttet for å forsøke å oppnå en terskelverdi for dosering, men er operasjonelt sett veldig lav. De positive resultatene for dispergering ved 13 C påvirket beslutningen i retning av redusert dosering. Tabell 5-1: Målte egenskaper og parametere under forsøk 5 Prøvenumme r Tid (timer) Vanninnhold (volum %) Fordampningsgra d (vekt %) Viskositet (mpa s), 10 s -1 Diesel i vann, ppm* 1 0,5 60 0, , , , , , , , påføring av dispergeringsmiddel: 14,4 g Dasic NS (DOR = 1:400, DER =1:1660, wt:vol) 3 min etter disp min etter disp min etter disp Påføring av dispergeringsmiddel: 25,8 g Dasic NS (DOR = 1:230 %, DER = 1:925, wt:vol) 3 min etter disp min etter disp min etter disp påføring av dispergeringsmiddel: 46,7 g Dasic NS (DOR = 1:130, DER = 1:500, wt:vol) 3 min etter disp min etter disp min etter disp påføring av dispergeringsmiddel: 58,5 g Corexit 9500 (DOR =1:100, DER =1:400, wt:vol) 10 min etter disp min etter disp Totalt påført dispergeringsmiddel: 145,4 g (DOR= 1:40, DER=1:160) -: ikke tilgjengelige data *: ppm = parts per million Det ble tatt prøver av emulsjonen etter første- og andregangs påføring av dispergeringsmiddel, og viskositetene til disse to prøvene er vist i Tabell 5-1, og viser en endring i emulsjonens egenskaper. Etter første påføring av Page 67 of 306
68 dispergeringsmiddelet økte viskositeten til emulsjonen, for så å reduseres igjen etter den andre påføringen av dispergeringsmiddelet. Som tidligere nevnt observeres generelt motsatt effekt (redusert viskositet) for råoljer og bunkersoljer. Resultatene viser også at vanninnholdet i emulsjonen ble betydelig redusert, fra 75 vol. % til 11 vol. % etter første dispergering, og den høyere viskositeten kan skyldes denne endringen i emulsjonen. De små vanndråpene som ble igjen etter reduksjonene i vanninnholdet har trolig bidratt til å danne en mer viskøs emulsjon. Det ble ikke målt større konsentrasjoner av nedblandet olje for de tre første påføringene av dispergeringsmiddel (alle med Dasic NS), men ved påføring av Corexit 9500 ved fjerde påføring økte den målte mengden nedblandet olje betraktelig. Det er utfordrende å tolke om den økte dispergerbarheten ved bruk av Corexit skyldes at dette dispergeringsmiddelet hadde en høyere effektivitet, eller om det skyldes kombinasjonen av dispergeringsmiddel eller den totale mengden dispergeringsmiddel. Screening av WRG med kjemisk dispergeringsmiddel viste at Dasic NS gav noe høyere effektivitet enn Corexit Screeningen ble gjennomført ved 13 C, og eventuelle variasjoner med temperatur har ikke blitt vurdert. Figur 5-1 viser massebalansen for WRG under forsøket mens Figur 5-2 viser effekten av påføring av dispergeringsmiddel. Bildene som er presentert på de neste sidene viser forsøkets gang. Figur 5-1: Massebalanse for forsøk 5, WRG 2 C Page 68 of 306

.")
69 Figur 5-2: Effekt av dispergeringsmiddel, forsøk 5, WRG 2 C 5.1 Bilder fra forsøk 5 Bildene som følger viser WRG ved 2 C over 72+ timer. Oljen emulgerte utover den første dagen i renna og endret karakter underveis i forsøket. Ved påføring av dispergeringsmiddel endret emulsjonen seg (også visuelt). Start: Under påføring var oljen gjennomsiktig brun, og stivnet til irregulære former da den traff vannet. Oljen la seg på overflaten og begynte å skumme (olje + vann) etter ti minutter Page 69 of 306


 ble")
70 P1: En gul skum-emulsjon hadde formet seg og brøt ikke fullsteding i skilletrakt ved prøvetaking. Prøver som ble stående på benk var stabile etter 24 timer stillstand. I løpet av det første døgnet (P1-P6) ble emulsjonene stadig tykkere. P2: Se P1. P3: Se P1. P4: Se P1. Page 70 of 306


71 P5: Se P1. P6: Se P1. P7: Emulsjonen hadde tyknet ytterligere. P8: Emulsjonen var mer ustabil enn ved tidligere prøvetakinger, og kan ha nådd sitt metningspunkt. Page 71 of 306


72 Dispergering 1: Begrenset effekt, emulsjonen endret karakter til "lettpisket fløte". Dispergering 2: Begrenset effekt. Dispergering 3: Begrenset effekt. Dispergering 4: Noe endring oppstod, oljedråper i vannet var mindre, men det meste av oljen lå fortsatt som emulsjon på overflaten. Etter 10 min økte adhesjonen til veggen. Moderat/begrenset effekt. Page 72 of 306
73 5.2 Sammenligning av resultater fra renna med prediksjoner Både resultatene fra renneforsøkene og fra dispergerbarhetstestingen viste at WRG-oljen hadde emulgerende egenskaper som i stor grad påvirkes av temperaturforholdene. Ved lave temperaturer hadde emulsjonene høyere viskositet og var mindre dispergerbare sammenlignet med til svarende resultater fra 13 C-forsøk. For å ta hensyn til disse variasjonene ble det laget en egen profil i Oil Weathering Model for WRG basert på 2 Cdata (benkeskala og renneforsøk). Denne profilen ble benyttet til å predikere egenskapene til WRG-oljen ved 2 C, og prediksjoner for emulsjonsviskositet, fordampning og vannopptak er presentert under sammen med resultater fra renneforsøket. Prediksjonene og de målte resultatene fra renneforsøket stemmer relativt godt overens for emulsjonsviskositet, men med noe lavere viskositeter målt etter 2-3 dager sammenlignet med prediksjonene. Også vannopptaket stemmer overens med prediksjonene, selv om enkelte målinger fra renna indikerer høyere vanninnhold. Lav fordampningsgrad ble også registrert i renna. Figur 5-3: Målt og predikert emulsjonsviskositet for WRG ved 2 C Page 73 of 306
74 Figur 5-4: Fordampning og vannopptak av WRG ved 2 C, predikerte og målte data Page 74 of 306
75 6 Konklusjoner Konklusjonene fra renneforsøkene listes her opp for hver av de testede oljene. WRG: Oljen viste emulgerende egenskaper med mulighet for vannopptak rundt 80 vol. % ved begge testtemperturer o Standard energi tilsvarende brytende bølger var nødvendig for innblanding av vann i oljefasen (emulgering) under renneforsøkene Egenskapene til oljen og emulsjonene ble påvirket av temperatur: o Emulgering skjedde saktere ved 2 C enn ved 13 C o Emulsjonsviskositetene var høyere ved 2 C ( mpa s) enn ved 13 C ( mpa s), men disse viskositetene er fortsatt lave i forhold til viskositeter fra råoljer o Emulsjonene hadde lav stabilitet, men noe høyere stabilitet ble observert ved 2 C enn ved 13 C Dispergerbarheten til emulsjonene var lavere ved 2 C enn ved 13 C Bruk av dosering (DOR) på 1:50 eller 1:25 anbefales ved dispergering av emulsjon, spesielt ved lave temperaturer (2 C). o Gjentatt dispergering kan øke effektiviteten o En viskositetsgrense for redusert effektivitet av dispergeringsmiddel er satt til 300 mpa s Ved mekanisk oppsamling kan lekkasje fra lenser grunnet lav viskositet bli en utfordring MGO: Renneforsøkene viste at MGO har evne til å inkorporere noe vann, men danner ikke skikkelige emulsjoner. Vann- og oljefasen skiltes raskt ved stillstand etter sammenblanding o Sammenblandingen skjedde tregere ved 2 C enn ved 13 C o Opptil 70 volum % vann ble inkorporert i oljen og dannet en ustabil blanding. Den mer stabile blandingen inneholdt kun 10 vol.% vann. Oljen og olje/vann-blandingen hadde svært lav viskositet, en maksimum viskositet på 17 mpa s ble målt under forsøket utført ved 2 C. Bruk av dispergeringsmiddel ble observert til å ha god effekt ved både 2 og 13 C, selv med lave doseringer (DER = 1:135 og 1:250, henholdsvis). 7 Referanser Fingas, M. and Fieldhouse, B., "Formation of water-in-oil emulsions and applications to oil spill modelling". Journal of Hazardous Materials 107, p Page 75 of 306
76 SINTEF Ocean AS Address: Postboks 4762 Torgarden NO-7465 Trondheim NORWAY Switchboard: Enterprise /VAT No: NO MVA Project memo Properties and dispersibility of Hybrid fuel oils DATE AUTHOR(S) Kaja Cecilie Hellstrøm CLIENT(S) Kystverket (Norwegian Coastal Administation) CLASSIFICATION Unrestricted CLIENTS REF. Silje Berger NO. OF PAGES AND APPENDICES: 35 with appendices ABSTRACT This memo contain results regarding the physical and chemical properties of hybrid fuel oils (Shell ULSFO and HDME 50) and one diesel fuel oil (Rotterdam diesel), at different temperatures. Dispersibility was also tested using the Field Effectiveness Test (FET), and these results are also included. PREPARED BY Kaja Cecilie Hellstrøm APPROVED BY Mimmi Throne-Holst Issued as part of report OC2017 A-123 Page 76 of 306
77 Table of contents 1 Introduction and background Experimental results Chemical composition and physical properties GC/FID gas chromatographic analysis Physical and chemical properties Emulsifying properties FET-test of dispersibility of ULSFO and HDME 50 emulsions HDME ULSFO Conclusion and recommended further work Conclusions, Rotterdam Diesel from Shell, the Netherlands Conclusions, hybrid products The following activities are recommended as further analysis References APPENDICES A Experimental setup B Pictures from FET-Testing Page 77 of 306
78 1 Introduction and background New types of fuels are rapidly being developed and produced in order to meet new requirements and regulations to airborne emissions of potentially harmful substances e.g. sulphur. These new fuels, hereby called hybrid oils, have not been studied with regard to weathering behaviour when spilled at sea, and this preliminary study has been performed in order to fill information gaps for two different hybrid products. The two hybrid products are HDME 50 from ExxonMobil and ULSFO from Shell. These hybrid oils are now regularly used as bunker fuel in SECA areas in Europe (Røyset, 2016). In addition to the hybrid products, parallel testing has been performed on a Rotterdam Diesel from Shell with the aim of comparing this product to previously studied diesels. This preliminary study has been an activity under the larger project "Diesel Fase II", and the Norwegian Coastal Administration (Kystverket) has provided both of the hybrid products as well as the Rotterdam Diesel used in this laboratory study. This has been done in cooperation with the RWS, North Sea Agency in the Netherlands. All products used in this study are summarized in Table 1-1 along with their individual SINTEF-ID and a description of the oil type. Table 1-1: Description of the oils used in this study SINTEF Name used Description of oil Also known as Sulphur content Producer Origin ID (wt. %) HDME 50 Hybrid Wide Range < 0.1 ExxonMobil Antwerp 0231 Gas oil Rotterdam Diesel Marine Gas oil (MGO) < 0.1 Shell Rotterdam ULSFO Hybrid Residual RMD % < 0.1 Shell Rotterdam 0233 Fuel oil Page 78 of 306
79 2 Experimental results The laboratory methods used in this preliminary study are described in Appendix Chemical composition and physical properties GC/FID gas chromatographic analysis The chemical composition of HDME 50, Rotterdam Diesel and ULSFO are shown in Figure 2-1 to Figure 2-3 as GC/FID chromatograms with both fresh and weathered residues. The gas chromatograms show the n-alkenes as systematic narrow peaks and the peaks to the left in the chromatogram represent the components with the lowest boiling point. As can be seen in Figure 2-3, these components are removed with higher distillation temperature. More complex components, such as resins and naphthenes, are not as easily separated as n-alkanes and form a broad and poorly defined bump below more pronounced peaks. The bump is often described as "Unresolved Complex Mixture", or UCM. Heavier compounds such as asphaltenes (>nc 40) are not possible to analyse with this technique. The HDME 50 shows a large UCM hump in Figure 2-1, which indicate a high content of complex components such as resins and naphthenes. Both HDME 50 and ULSFO are considered hybrid oils while the Rotterdam Diesel is a marine gas oil. Though both HDME 50 and ULSFO are considered hybrid products, they have different origins. HDME 50 is a wide range gas oil, made from heavy distillation cuts. The ULSFO is a residual fuel oil, containing a broader spectre of components (lighter and heavier) compared to the HDME 50. For this reason, ULSFO and HDME 50 show very varying chromatographic profiles, with HDME consisting of a narrower range of components compared to ULSFO. A large UCM hump is characteristic for the HDME 50, with paraffinic compounds being present within the cut range (C 15-C 40). The HDME does not contain any light components and this was reflected in the attempted, but unsuccessful, evaporation of HDME 50, with aim to produce a 250 C+ residue. 250 C+ residues were made for both the ULSFO hybrid oil and Rotterdam Diesel. The Rotterdam Diesel lack lighter paraffinic compounds (< C 10), and the lighter, irregular components observed in the chromatogram is likely aromatic compounds. Aromatic compounds are of the toxic and such a comparatively high presence of these compounds are worrying in regards of the oil's toxicity. Quantification of semi-volatile aromatics can be done by use of GC-MS. Gas chromatography (GC/FID) is an important tool for oil characterisation and for oil spill identification as an initial step. Common screening parameters used for identification, as well as for the degree of biodegradation, are the nc 17/Pristane and nc 18/Phytane ratios. These parameters are listed in Table 2-1 for the tested oils. Figure 2-1: Chromatogram of fresh HDME 50 hybrid oil Page 79 of 306
80 Rotterdam Diesel, Fresh oil Rotterdam Diesel, residue Figure 2-2: Chromatogram of fresh Rotterdam Diesel ( ) USLFO, Fresh oil ULSFO, Figure 2-3: Chromatogram of fresh and weathered ULSFO hybrid oil Page 80 of 306
81 MGO Fresh ( ) GO (Farget) Fresh ( ) WRG Fresh ( ) Figure 2-4: Gas chromatograms of previously tested diesel oils: MGO, GO (Farget) and WRG Table 2-1: List the ratio of nc17/pristane and nc18/phytane for the fresh hybrid oils, HDME 50 and ULSFO, and the Rotterdam Diesel with their respective SINTEF ID Oil SINTEF-ID nc 17/Pristane nc 18/Phytane HDME Rotterdam Diesel ULSFO Page 81 of 306
82 2.1.2 Physical and chemical properties The chemical properties of asphaltene and wax contents for the three tested oils are given in Table 2-2. The Diesel oil has the lowest content of both wax and asphaltenes of the tested oils, but the wax content is high for the oil type compared to previously tested diesel oils (Forstudie Diesel forvitring and Diesel Fase II), MGO ( ) and GO ( ). The asphaltenic content of the Rotterdam Diesel was measured to be similar to that of these previously tested diesel oils. However, since the diesel has been produced from specific distillation cuts and asphaltenes would not be part of this distillation cut, the measured content is most likely caused by precipitation of other compounds. The hybrid oils HDME 50 and ULSFO have higher content of wax compared to the diesel, but differ also when compared to each other. ULSFO has a higher wax content (13.1 wt. %) than HDME 50, and also has a higher asphaltenic content. Similarly to the Rotterdam Diesel, HDME 50 is made from a distillation cut (heavier than the diesel). The measured asphaltenic content likely reflects the precipitation of other compounds rather than a true asphaltenic content. The distillate cut that HDME consist of would not include asphaltenes, in contrary to the residual fuel ULSFO where a asphaltene content would be expected. The HDME 50 has only been listed with values for fresh oil since this oil did not evaporate when artificial weathering was attempted. Both wax and asphaltenes contribute to stabilizing water-in-oil emulsions. Asphaltenes often have a polar part which interact with the oil-water interphase, while waxy compounds contribute to stabilise the asphaltenes in such a position near the water-oil interface. Thus, oils that contain much wax but very little asphaltene often form unstable emulsions that may break due to the lacking stabilising effect of asphaltenes. In regard to emulsion formation and stabilisation, asphaltene content can be important for an operative perspective. However, a high wax content will contribute increase the pour point of an oil, potentially resulting in another important effect: solidification. Table 2-2: Asphaltene ("hard") and wax content for the two hybrid oils and the Rotterdam Diesel Oil type Residue Asphaltenes Wax "hard" (wt. %) (wt. %) HDME 50 Fresh Rotterdam Diesel Fresh C ULSFO Fresh C MGO 500 ppm S Fresh C GO 10 ppm S Fresh C WRG Fresh Physical properties of the tested oils are presented in Table 2-3 and Table 2-4 (marked with green) along with data for previously tested diesel oils. In general, the Rotterdam Diesel was heavier than the MGO and GO diesels. The density and flash point was higher and the Rotterdam Diesel had a lower evaporative loss compared to MGO and GO diesels. The viscosity of the Rotterdam was also higher than these diesels. However, all parameters are within the limits for the DMA quality grade (see Tabell 2.1 in Sørheim and Daling, 2015). HDME 50 had a higher density than ULSFO as well as a considerably higher flash point due to lack of components in the <C 15 range, higher even than for the weathered ULSFO residue (250 C+). However, the pour point and viscosities measured were lower for HDME 50 than for ULSFO. This is likely due to the higher content of wax found in ULSFO, which influence the pour point by wax lattice formation, as well as the oil viscosity. Compared to the WRG, the HDME 50 had a wax content twice as high. The higher content of wax also influence the pour point of the oil, which was significantly higher for the HDME 50 compared to the WRG. The WRG expressed a pour point of -24 C while the pour point of HDME 50 was measured to 12 C. Page 82 of 306
83 The HDME 50 had a tenfold higher viscosity at 2 C compared to viscosities at 13 C, but this increase should be viewed in relation to the pour point of the oil. As mentioned, HDME 50 had a high pour point, and at 2 C wax lattice formation and solidification will have influenced the viscosity. ULSFO had high pour points for both the fresh oil and residues, and solidification occurred at room temperature for both oil fractions. This affected the viscosities (similarly to HDME at 2 C), and the viscosities were high. Solidification will influence effectiveness of chemical components since a solid oil surface will prevent the dispersant from soaking into the oil, thus having a higher risk of being washed of. Risk of solidification should be taken under consideration during contingency planning in order to provide suitable and necessary recovery equipment for a spill in colder regions. The ULSFO oil can has a measured viscosity of 11 cp at 50 C, according to the received data sheet. This alone would classify ULSFO as a relatively light residual fuel oil (IFO 11). However, the oil is expected to have high viscosities at low temperatures which may give it properties similar to a heavier fuel oil. The HDME 50 is a wide range gas oil, and cannot be compared to IFO. Table 2-3: Physical properties of the hybrid oils and the Rotterdam Diesel (marked in green) compared with similar results for MGO, GO and WRG oils. Oil type Residue Evaporation (vol. %) Residue (wt. %) Density (g/ml) Flash point ( C) Pour point ( C) HDME 50 Fresh ULSFO Fresh C Rotterdam Diesel Fresh < C MGO Fresh < ppm S 250 C <-36 GO Fresh < ppm S 250 C WRG Fresh Table 2-4: Physical properties of the hybrid oils and the Rotterdam Diesel (marked green) compared with results for MGO, GO (Farget) and WRG oil: Viscosity and interfacial tension Oil type Residue Viscosity Viscosity Viscosity IFTin IFTeq (mpa s) (mpa s) (mpa s) 2 C (10 s -1 ) 13 C (10 s -1 (mn/m) (mn/m) ) 50 C (*40 C) HDME 50 Fresh ULSFO Fresh C Rotterdam Diesel Fresh * C MGO Fresh ppm S 250 C GO Fresh ppm S 250 C WRG Fresh / 17.4* Page 83 of 306

")
84 2.1.3 Emulsifying properties The emulsifying properties of the Rotterdam Diesel and the hybrid oils were studied by use of the rotating cylinders (Hokstad et al., 1993). The Rotterdam Diesel and hybrid oils were initially tested at 13 C, but due to suspected temperature dependent properties, the hybrid oils were tested further at both 2 and 20 C. These temperatures were chosen to cover the expected temperature range from the area these oils are used in. Figure 2-5 to Figure 2-11 below show the rotating cylinders for all oils at the three different temperatures; 250 C+ residue of Rotterdam Diesel, Fresh HDME 50, and both fresh and weathered (250 C+) fraction of ULSFO. Four cylinders of each fraction were used in each test, in order to obtain all necessary data of the emulsifying properties. The cylinders with Rotterdam Diesel residue are shown in Figure 2-5 and express no water uptake, although a small amount of foam was seen to form on top of the oil. The lack of emulsifying properties made the oil unsuitable for testing with demulsifier. The oil will likely also have a shorter lifetime at sea due to the inability to form emulsions. Figure 2-5: The rotating cylinders containing Rotterdam Diesel after 24 hr rotation. The close up to the right show the foam that formed during rotation, and also show the lack of total volume increase due to lack of emulsification. The rotating cylinders with fresh HDME 50 from each of the three test temperatures are shown in Figure 2-6 to Figure 2-8 after 24 hours of rotation (left) and after the application of emulsion breaker (right). Two blue lines in the pictures indicate the original thickness of the oil before rotation, and the upper line thus express the total volume of liquids present in the cylinder before rotation was initiated. A small total volume increase can be seen in at all temperatures (e.g. Figure 2-7, left) and indicate incorporation of a small volume of air into the emulsion. The right hand pictures of each figure show the effect of application of emulsion breaker with the reference placed to the right. Page 84 of 306

, at 2 C.")

, at 13 C.")
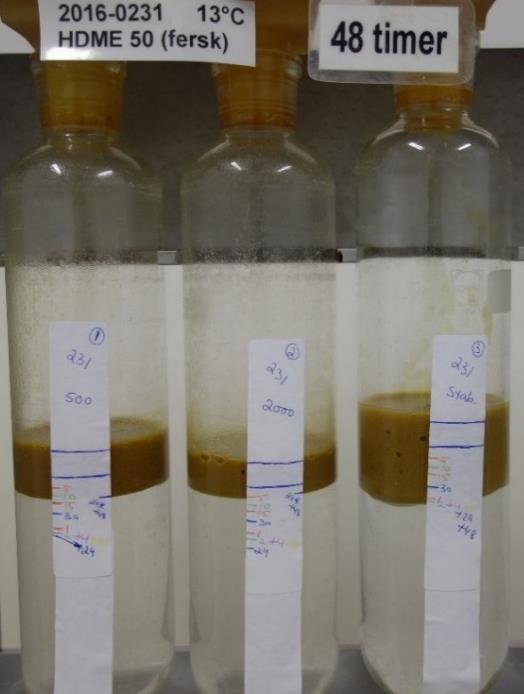
85 Figure 2-6: Rotating cylinders expressing the emulsifying properties of HDME 50 after 24 hrs rotation (left) and application of emulsion breaker (middle and right), at 2 C. The dosages of emulsion breaker were 500 ppm and 2000 ppm, with a reference emulsion to the far right. Figure 2-7: Rotating cylinders expressing the emulsifying properties of HDME 50 after 24 hrs rotation (left) and application of emulsion breaker (right), at 13 C. The dosages of emulsion breaker were 500 ppm and 2000 ppm, with a reference emulsion to the far right. Page 85 of 306


86 Figure 2-8: Rotating cylinders expressing the emulsifying properties of HDME 50 after 24 hrs rotation (left) and application of emulsion breaker (middle and right), at 20 C. The dosages of emulsion breaker were 500 ppm and 2000 ppm, with a reference emulsion to the far right. ULSFO was the only oil that was tested for emulsifying properties on both fresh oil and weathered residue. Figure 2-9 to Figure 2-11 shows the rotating cylinders after 24 hours of rotation with the fresh oil towards the left and the weathered 250 C+ residue toward the right in the presented pictures. Visually, there is a clear difference from the HDME 50 oil, with ULSFO having a much darker, almost black colour indicating a higher content of heavy components such as asphaltenes. Unlike HDME 50, none of the ULSFO cylinders shows signs of incorporating air, and the total volume of oil and water remain the same throughout the testing. The fresh ULSFO can be seen to have a higher water uptake than the weathered residue at all test temperatures, likely due to the very high pour point of the weathered residue (30 C) preventing water from being mixed into the oil. Variances were observed between the tests at different temperatures. The total water uptake was lower with colder temperatures, increasing with temperature. At 2 C, the weathered residue solidified and formed irregular shapes, and the total water uptake was low. Similar, but less extreme, behaviour was observed for the weathered residue during the tests at 13 C and 20 C. Emulsions were formed but did not become an even layer on top of the water phase due to high emulsion viscosity. The ULSFO oil had the highest content of wax and asphaltenes of the tested oils and during emulsification at 13 C formation of waxy lumps were observed. An example of such a lump is shown in Figure 2-12 and was formed from the 250 C+ residue. A waxy lump such as this may have a different weathering behavior compared to the oil and likely have prolonged lifetime at sea. Page 86 of 306


")
 after 24 hours of rotation at 13 C.")
87 Figure 2-9: Rotating cylinders expressing the emulsifying properties of fresh and weathered ULSFO (four parallels of each) after 24 hours of rotation at 2 C. Figure 2-10: Rotating cylinders expressing the emulsifying properties of fresh (left) and weathered (right) ULSFO (four parallels of each) after 24 hours of rotation at 13 C. Page 87 of 306


88 Figure 2-11: Rotating cylinders expressing the emulsifying properties of fresh and weathered ULSFO (four parallels of each) after 24 hours of rotation at 20 C Figure 2-12: A waxy lump formed from the 250 C+ ULSFO residue at 13 C. The lump was approximately 2 cm in diameter Page 88 of 306
89 Water uptake and maximum water content The parameters for kinetics (rate of water uptake) and maximum water uptake were studied by use of the rotating cylinders, similar to the emulsifying properties, at 2 C, 13 C and 20 C. The water content in the water-to-oil emulsions as a function of time and results for the three oils are shown in Table 2-5 to Table 2-7. T 1/2 is a constant defined as the time (hours) required to incorporate half the maximum water quantity and is derived from the tabulated data for each oil and residue. The Rotterdam Diesel was only tested at 13 C, and did not take up any noticeable amount of water and does not have a T 1/2 (set at 0). The HDME 50 was tested at all three temperatures and expressed a rapid water uptake at 13 and 20 C. Half the total water content was calculated to be incorporated within 0.15 hours (9 minutes) at 13 C and within 0.12 hours (7 min). At 2 C the water uptake was considerably slower, with a T 1/2 of 2.2 hours (2 hr and 12 min). Fresh ULSFO had a longer T 1/2 than HDME 50 at all temperatures, with 2.90 hours (2 hrs and 54 min) at 2 C, 0.44 hours (26 minutes) at 13 C, and 0.30 hours (18 min) at 20 C. Both HDME 50 and fresh ULSFO express a shorter T 1/2 with increasing temperatures. The weathered ULSFO 250 C+ residue did not express similar temperature dependent behaviour for water incorporation, and had a rapid water uptake at 2 C. However, at this temperature the residue solidified and had a very low and rapid water uptake (14 vol %, T 1/2= 2,4 min). At 13 and 20 C the residue was found to have T 1/2 of 1.20 (1 hr and 12 min) and 0.50 (30 min), respectively. HDME 50 and both fresh and weathered ULSFO expressed a higher maximum water uptake with increasing temperatures. Table 2-5: Water uptake for the fresh HDME 50 and fresh and weathered residue of ULSFO, at 2 C HDME Fresh ULSFO Fresh USLFO 250 Mixing time C + (Vol. % water) (Vol. % water) (Vol. % water) Start min min min min hour hours hours hours hours T 1/ Table 2-6: Water uptake for fresh HDME 50, Rotterdam Diesel and fresh oil and residue of ULSFO at 13 C HDME Fresh ULSFO Fresh USLFO 250 Mixing time C + Diesel Rotterdam 250 C (Vol. % water) (Vol. % water) (Vol. % water) (Vol. % water) Start min min min min hour hours hours hours hours T 1/ Page 89 of 306
90 Table 2-7: Water uptake for the fresh HDME 50 and fresh and weathered residue of ULSFO, at 20 C HDME Fresh ULSFO Fresh USLFO 250 Mixing time C + (Vol. % water) (Vol. % water) (Vol. % water) Start min min min min hour hours hours hours hours T 1/ Stability and efficiency of emulsion breaker The stability of the emulsions from the fresh oils and weathered residue of ULSFO was tested by quantifying the amount of water released from the emulsion during 24 hours of settling after 24 hours of rotation. In addition, the efficiency of emulsion breaker (Alcopol O 60 %) was evaluated for each emulsion. Since Rotterdam Diesel did not form emulsions, these tests did not provide any results. The results for HDME 50 and ULSFO Fresh and 250 C+ are given in Table 2-8, Table 2-9 and Table 2-10, respectively, for all three test temperatures. The untreated HDME 50 emulsion was stable or almost completely stable, only losing 1 vol. % water during 24 hours stand still at 13 C, as shown in Table 2-8. Over all for the different test temperatures, the emulsions treated with the two different dosages of emulsion breaker had a higher release of water in comparison to the respective untreated emulsions, and the effect was higher with increased dosage. The use of emulsion breaker was also more effective with higher temperatures. Table 2-8: Stability of emulsion and the effect of emulsion breaker on HDME 50 fresh, for all three test temperatures Water-in-oil emulsion (vol. %) Stability Temperature Residue Emulsion breaker Reference 24 hours * ratio** Fresh none C Fresh Alc. O 60 % 500 ppm Fresh Alc. O 60 % 2000 ppm Fresh none C Fresh Alc. O 60 % 500 ppm Fresh Alc. O 60 % 2000 ppm Fresh none C Fresh Alc. O 60 % 500 ppm Fresh Alc. O 60 % 2000 ppm ppm: parts per million *: w/o emulsion after 24 hours rotation and 24 hours settling ** Stability ratio of 0 implies a totally unstable emulsion after 24 hours settling; all the water is settled out during 24 hours settling. Stability ratio of 1 implies a totally stable emulsion Table 2-9 shows that the emulsions made from fresh ULSFO were nearly, or completely, stable when left at stand still for 24 hours at the three test temperatures. At 13 C, the application of the lowest dosage of emulsion breaker (500 ppm) did not cause any loss of water in the fresh oil emulsion. At the two other test temperatures, the lower dosage had some demulsifying effect. At all tree temperatures, the higher dosage of 2000 ppm had the best effect, reducing the content of water in the emulsions significantly. Page 90 of 306
91 Table 2-9: Stability of emulsion and the effect of emulsion breaker on ULSFO fresh, for all three test temperatures Temperature Residue Emulsion breaker Water-in-oil emulsion (vol. %) Stability Reference 24 hours * ratio** fresh none C fresh Alc. O 60 % 500 ppm fresh Alc. O 60 % 2000 ppm fresh none C fresh Alc. O 60 % 500 ppm fresh Alc. O 60 % 2000 ppm fresh none C fresh Alc. O 60 % 500 ppm fresh Alc. O 60 % 2000 ppm ppm: parts per million *: w/o emulsion after 24 hours rotation and 24 hours settling ** Stability ratio of 0 implies a totally unstable emulsion after 24 hours settling; all the water is settled out during 24 hours settling. Stability ratio of 1 implies a totally stable emulsion Similar to the fresh ULSFO oil, emulsions of the weathered residue of ULSFO were stable or nearly stable when left untreated at standstill for 24 hours. Table 2-10 show the stability of the emulsions from the different test, with the different dosage treatments. At 2 C, the emulsion was nearly solidified and the application of demulsifier did not have any effect, likely caused by prevented soaking due to the high viscosity/pour point of the emulsion. At 13 and 20 C, the residue formed emulsions with higher water content, and the effect of emulsion breaker was also seen to be more effective. For these two temperatures, the highest dosage showed the best effectiveness. Table 2-10: Stability of emulsion and the effect of emulsion breaker on ULSFO 250 C, for all three test temperature Temperatures Residue Emulsion breaker Water-in-oil emulsion (vol. %) Stability Reference 24 hours * ratio** 250 C none C 250 C Alc. O 60 % 500 ppm C Alc. O 60 % 2000 ppm C none C 250 C Alc. O 60 % 500 ppm C Alc. O 60 % 2000 ppm C none C 250 C Alc. O 60 % 500 ppm C Alc. O 60 % 2000 ppm ppm: parts per million *: w/o emulsion after 24 hours rotation and 24 hours settling ** Stability ratio of 0 implies a totally unstable emulsion after 24 hours settling; all the water is settled out during 24 hours settling. Stability ratio of 1 implies a totally stable emulsion Viscosity of emulsified residues Page 91 of 306
92 Table 2-11 gives the viscosities of the fresh oil and weathered residue for the Rotterdam Diesel, tested at 13 C. Table 2-12, Table 2-13 and Table 2-14 show the viscosities of both water-free oils and emulsion, for HDME 50, ULSFO Fresh and ULSFO 250 C+, respectively, at 2, 13 and 20 C. The maximum water content in the emulsions at the different temperatures are also provided for each oil and residue. As non-newtonian fluids, the viscosities of oil and emulsions are dependent on the shear rate; the viscosities are higher at a lower share rate (10 s -1 ) compared to higher shear rate (100 s -1 ). This decrease in viscosity with increasing shear rate is likely caused by breaking up the wax lattice structure with increased mechanical force, and is observed for all the oils and emulsions. The viscosities for the 250 C+ water-free fraction of Rotterdam Diesel, shown in Table 2-11, may appear to be an exception. However, the Rotterdam diesel has a low pour point, low viscosities and nearly Newtonian properties, and would not be expected to show significantly decreased viscosities with increasing shear rate. The measured free water in the rotating cylinder used for viscosity measurements, indicate that Rotterdam Diesel had a small water uptake of 3 vol. %. This small water uptake only affected the viscosity slightly, with an increase from 14 mpa s for the water-free residue to 17 mpa s for the emulsified residue. The viscosities of the hybrid products were higher than the Rotterdam Diesel. The HDME 50 obtained emulsion viscosities up to 9500 mpa s at 13 C (68 vol. %), while ULSFO at this temperature obtained emulsion viscosities up to mpa s for the weathered residue (71 vol. %). However, the water free ULSFO 250 C+ residue expressed a higher viscosity compared to the emulsion made from the same residue. This indicate that the water obtained in the emulsion contribute to a lowered viscosity, and the behaviour has been observed previously for oils with high pour points and high wax content, generally heavy fuel oils. The behaviour occur when the wax lattice formed in the water-free residue is stronger than in the emulsion; the water has contributed to a broken and weakened wax lattice. Fresh ULSFO did not express the same trend since the emulsion viscosity was higher compared to the water-free fresh oil alone. Both HDME and ULSFO emulsions showed clear temperature dependent variations in viscosity, with higher viscosities at lower temperatures. At 2 C the viscosities of both HDME 50 and both ULSFO fractions were higher than at 13 C. At 20 C, the viscosities were lower than at 13 C, while the maximum water content of the emulsions increased. At 2 C, ULSFO 250 C appeared to solidify rapidly and was not observed to take up much water. However, a lower viscosity for the attempted emulsified residue compared to the water-free fraction indicate that some water has been incorporated into the oil and contributed to a lowered viscosity, as was observed in the 13 C test. Solidification at low temperatures was suspected for ULSFO, and was one of the arguments for performing emulsion testing at lower temperature. Solidification of oil and emulsion will affect the needs for contingency planning. Solid or semi-solid oils and emulsions will usually not respond well to the addition of chemical dispersants, and may require specific skimmers for mechanical recovery. Since the weathered residue solidifies at the lower temperatures, the bench-scale testing performed will not reflect a realistic scenario. If spilled on to the sea surface, ULSFO would emulsify significantly before reaching a weathering state similar to the evaporated 250 C+ residue. In order to obtain more realistic data for the weathering of ULSFO for entry to the oil weathering model (OWM), meso-scale flume tests would be necessary. Meso-scale experiments would provide data for maximum water content and viscosities for input to the OWM, in addition to giving valuable information on the weathering behaviour of the oil at different temperatures. Meso-scale testing at 2 and 13 C is therefore recommended. At warmer temperatures (20 C), the higher maximum water content can result in a drastically increased emulsion volume compared to the volume of spilled oil. This can influence the capacities for mechanical recovery with respect to storage space. However, emulsions at warmer temperatures will likely respond better towards chemical dispersants. The effect of chemical dispersants has been roughly tested by the use of Field Effectiveness Test, described in the next section. The maximum water content and dispersibility would be better established through a meso-scale flume test at performed at 20 C. Page 92 of 306
93 Table 2-11: Viscosity of water free residues and emulsions of the Rotterdam Diesel, both fresh and weathered residue at 13 C Residue Rotterdam Diesel Water content Viscosity (mpa s) 13 C (vol. %) 10 s s -1 Fresh C Fresh C+ < : the attempted emulsion was not obtained due to lower water uptake Table 2-12: Viscosity of water free residues and emulsions of HDME 50 at 2, 13 and 20 C HDME 50 HDME 50 HDME 50 Water content Viscosity (mpa s) 2 C Viscosity (mpa s) 13 C Viscosity (mpa s) 20 C (vol. %) 10 s s s s s s /68/ *: water contents are given for 2/13/20 C -: the attempted emulsion was not obtained due to lower water uptake Table 2-13: Viscosity of water free residues and emulsions of ULSFO Fresh at 2, 13 and 20 C ULSFO Fresh ULSFO Fresh ULSFO Fresh Water content Viscosity (mpa s) 2 C Viscosity (mpa s) 13 C Viscosity (mpa s) 20 C (vol. %) 10 s s s s s s /84/ *: water contents are given for 2/13/20 C -: the attempted emulsion was not obtained due to lower water uptake Table 2-14: Viscosity of water free residues and emulsions of ULSFO 250 C+ at 2, 13 and 20 C ULSFO 250 C+ ULSFO 250 C+ ULSFO 250 C+ Water content Viscosity (mpa s) 2 C Viscosity (mpa s) 13 C Viscosity (mpa s) 20 C (vol. %) 10 s s s s s s /71/ *: water contents are given for 2/13/20 C -: the attempted emulsion was not obtained due to lower water uptake Page 93 of 306
94 2.2 FET-test of dispersibility of ULSFO and HDME 50 emulsions During the initial testing of the emulsifying properties of ULSFO at 13 C, FET-test (Field Effectiveness Test) was performed on the emulsions with maximum water content from both fresh oil and 250 C+ residue. Similar tests were performed during the testing at 2 and 20 C, and in addition to testing the max. water emulsions, emulsions with 50 and 75 vol. % were (attempted) formed and tested. The HDME 50 oil was also tested using FET-tests at 2 and 20 C, but were not performed at 13 C. A FET-test is usually performed in field for indication of dispersant effectiveness, for a on site evaluation of dispersibility. The test include use of two volumetric cylinders (100 ml), both containing 80 ml of sea water and a few millilitres of the relevant emulsion. Chemical dispersant is applied onto the emulsion in one of the cylinders and left to soak for 1 minute, after which both cylinders are gently turned upside down synchronically for 1 minute. The changes in the cylinders are observed and compared between treated and untreated emulsion. The results from the FET-testing is presented for the ULSFO and HDME oils separately and discussed. Pictures of the tests are included in Appendix B, while the results are summarized in tables. Table 2-15 shows the emulsions that were formed for the different oils at the two test temperatures. Table 2-15: Summarization of emulsions that were formed: x for formed emulsions, - for emulsions that did not incorporate the total water content, and specifications of maximum water content Water HDME 50 ULSFO Fresh ULSFO 250 C+ content 2 C 20 C 2 C 20 C 2 C 20 C 50 % - x x x - x 75 % - x - x - x M.W HDME 50 The results from the FET-testing of HDME 50 is given in Table 2-16 according to the definitions "Dispersible", "Reduced dispersibility" and "Not dispersible". Emulsions that were not formed, and thus not analysed, are indicated with "-". At 2 C the HDME 50 did not manage to form the 75 % or the 50 % emulsions, and only the max. water emulsion was used for FET-testing at this temperature. At 20 C, all three emulsions were formed and used for the FET-test. HDME 50 has a light colour, which must be considered when estimating the dispersibility by use of eyesight, since significant dispersed oil may not provide a clear colour. The results indicate that the dispersibility of the emulsion is temperature dependent. At 2 C, the oil and emulsion may solidify due to the high pour point of the oil (12 C) and prevent the chemical dispersant from soaking into the oil phase. This problem would not occur at 20 C, and the results show that all the emulsions are dispersible at this higher temperature. In order to assess dispersibility at an intermediate temperature, further dispersibility testing is recommended performed at 13 C. Table 2-16: Dispersibility estimates from the FET-test on HDME 50 emulsions at 2 and 20 C. annotates which emulsions that were not formed. Water content HDME 50 2 C 20 C 0 % Reduced dispersibility Dispersible 50 % - Dispersible 75 % - Dispersible M.W. Not dispersible Dispersible -: the attempted emulsion was not obtained due to lower water uptake Page 94 of 306

95 2.2.2 ULSFO Emulsions of ULSFO were tested at 2 and 20 C similarly to HDME 50, and the results are summarized in Table 2-17, with the same classifications as for HDME 50. ULSFO also show a temperature dependent dispersibility, with poorer dispersibility at lower temperatures. The 250 C+ was clearly below its pour point at 2 C, and had solidified prior to testing. When making the ULSFO emulsion at 2 C, the fresh ULSFO oil had also solidified in the cylinder containing 50 % oil and 50 % water, prior to the emulsification stage. In addition to the influence of temperature, the dispersibility of ULSFO was seen to be affected by degree of weathering. The 250 C+ residue showed poorer dispersibility compared to the fresh oil for all emulsions and temperatures. Table 2-17: Dispersibility estimates from the FET-test on fresh and weathered ULSFO emulsions at 2 and 20 C. annotates which emulsions that were not formed, while empty Water ULSFO Fresh ULSFO 250 C+ content 2 C 13 C 20 C 2 C 13 C 20 C 0 % Reduced dispersibility Dispersible 50 % Reduced dispersibility Dispersible - Dispersible 75 % - Dispersible - Reduced dispersibility M.W. Reduced dispersibility Reduced dispersibility Dispersible Not dispersible Not dispersible Not dispersible A FET-test was conducted on the max. water emulsions of fresh and weathered ULSFO after testing the emulsifying properties at 13 C. The fresh m.w.-emulsion showed reduced dispersibility with formation of larger droplets that rose rapidly, in combination with some long lasting discolouration of the water phase caused by smaller oil droplets. Figure 2-13 shows the two cylinders containing fresh ULSFO emulsion immediately after rotation. The stop watch was started at application of dispersant, thus reading 2 minutes (1 min soaking + 1 min rotation). The max. water emulsion made from weathered ULSFO (250 C+) at 13 C contained approximately 71 vol. % water, and showed poor dispersibility in the performed test. The emulsion was split into larger pieces but did not form droplets. Figure 2-14 shows the two cylinders containing weathered ULSFO 250 C+ emulsion immediately after rotation. The emulsion was deemed not dispersible. However, repeated application of dispersant may give better effect. Figure 2-13: Show the max water emulsion of fresh ULSFO at 13 C immediately after 1 min of rotation. The emulsion was deemed to have reduced dispersibility. Page 95 of 306

96 Figure 2-14: show the weathered ULSFO 250 C+ max. water emulsion at 13 C immediately after rotation. The emulsion was deemed to be not dispersible. Page 96 of 306
97 3 Conclusion and recommended further work 3.1 Conclusions, Rotterdam Diesel from Shell, the Netherlands The Rotterdam Diesel has a higher density and lower evaporative loss than the Marine Gas oils that were previously tested in other activities in this project. The GC-chromatogram indicate a high content of semisoluble aromatics (e.g. PAH). The viscosities were comparable between the Marine Gas oils and the Rotterdam Diesel, pour points were similar, and the Rotterdam Diesel did not show significant emulsifying properties during the testing with rotating cylinders. All measured parameters were within the DMA requirements that apply to the Rotterdam Diesel. It is expected that natural dispersion would be the main route for removal from sea surface in a spill situation, since the evaporative loss would be low. Proposed further work for Rotterdam Diesel include: Input and adjustment of obtained results to the OWM for predictions of behaviour and properties at sea. Formation of chemical oil profile for input to OSCAR. The toxicity of this oil is proposed tested through WAF testing, due to the presence of aromatic compounds. Screening and dosage testing of chemical dispersants on the weathered fraction, for comparison to the previously tested MG oils. In addition, ignitability testing is proposed for the fresh and weathered residue in order to relate this property to the ignitibility of the other previously tested diesel oils. 3.2 Conclusions, hybrid products The two hybrid products analysed in this study show differences in chemical composition and physical properties, including viscosity and colour. Both oils express strong temperature dependent viscosities for water-free fractions. HDME 50: The HDME 50 is a WRG-product with little or no content of lighter components (< C 15), and is made from heavier and longer cuts than the previously tested Wide Range Gas oil ( ). The lack of easily ignitable components increase the flash point of this oil, which has been measured to 186 C for the fresh oil. Due to the high flash point, HDME 50 is considered to not be ignitable based on ignitability testing previously performed on a lighter wide range gas oil. The wax content of HDME 50 is twice as high as in the WRG, and the pour point is also considerably higher (12 C for the HDME 50 compared to -24 C for WRG). The oil formed stable emulsions with a water content up to 68 %, and a viscosity of 9500 mpa s at 13 C. The emulsion viscosities were found to be higher in colder conditions due to the high pour point of the oil, and FET-testing showed poorer dispersibility at lower temperatures. The gas chromatography show that the oil has a large UCM hump: a large part of the oil cannot be qualified with the used GC-methodology. The compounds that make up this UCM hump can be polar, and may contribute to the oils toxicity. For this reason, a limited WAF study is recommended for this oil, for comparison of the chemical composition of the WAF-profiles of the WRG and HDME 50. ULSFO: The ULSFO oil contains some light components that gives the oil a low evaporative loss, which again cause a relative increase in the already high wax content. The high wax content result in a high pour point for the ULSFO, 24 C for fresh oil and 30 C for the weathered 250 C+ residue. Emulsions of both fresh oil and the 250 C+ residue form stable emulsions, and formation of waxy lumps were observed in the 250 C+ emulsions during testing at 13 C. The high pour point was seen to cause solidification at lower temperatures, which affected the dispersibility of the oil in the FET-tests, and will affect the dispersibility of the oil and its emulsions. The large variety between the hybrid oils may also be mirrored in their toxic effect on marine life. In addition, due to the large variations in physical properties, e.g. viscosity, the oils may require different counter measurements in a spill situation. In this respect, effectiveness of chemical dispersants would be important information for both the HDME 50 and the ULSFO oils. Page 97 of 306
98 3.3 The following activities are recommended as further analysis 1) Oil profile: It is recommended to produce chemical profiles and profiles in the Oil Weathering data base of the Rotterdam Diesel, HDME 50 and the ULSFO oils. These profiles will be available in the OSCAR model for modelling. In addition, use of the OWM for producing predictions of the behaviour of the three oils at various temperatures at wind conditions is recommended. 2) WAF Toxicity testing: The water accommodated fraction is recommended tested for Rotterdam Diesel, HDME 50 and ULSFO oils (with residues where these exist). The HDME 50 is a wide range gas oil, and may have similar WAF compared to the previously tested WRG. As an initial step, the chemistry of the WAF of HDME 50 is recommended to be tested and compared to WRG before any toxicity studies are initiated. For Rotterdam Diesel and ULSFO, toxicity testing at two trophic levels is proposed in order to ascertain the toxicity of these two oils. 3) Dispersibility testing, 13 C: The FET-testing showed clear differences in dispersibility dependent on the ambient temperature for both HDME 50 and ULSFO. At 2 C the oils show a low or reduced dispersibility, and it is deemed that the oils would in general be poorly dispersible at low temperatures. The results obtained at 20 C show generally good dispersibility. Based on the obtained results, testing at an intermediate temperature, 13 C, is recommended. Establishing the dispersibility of the two oils at this temperature, as well as a window of opportunity for use of chemical dispersants, will provide a good basis for predictions of dispersibility at other temperatures as well. It is also recommended that the screening and dosage testing should be performed for the Rotterdam Diesel. 4) Meso-scale testing: Testing in the meso-scale facilities are recommended for obtaining results for the oils behaviour (emulsifying properties, both natural and chemical dispersibility, etc.) under more realistic conditions. The evaporation and emulsification of the oil would occur simultaneously instead of step wise as performed in the bench scale study, and under influence of wind, wave and solar energy. These variations may uncover previously not observed behaviour (e.g. MGO at 13 C formed loose and unstable emulsion in the flume, but not during initial bench-scale studies). ULSFO, HDME 50 and Rotterdam Diesel are recommended tested in the meso-scale flume at 13 C. Due to the high pour point of ULSFO this oil is expected to solidify rapidly at lower temperatures, and further testing at 2 C is not recommended. The HDME 50 has a lower pour point than the ULSFO oil and may not solidify under conditions with constant movement. For this reason, meso-scale testing at 2 C is recommended as an option. Dispersion applicatopn in the meso-scale tests will also be valuable documentation for dispersant application strategies for the different oils (e.g. dosage, re-treatment etc.). 5) Rheology: The ULSFO oil has been seen to have a drastic increase in viscosity with decreasing temperatures. In order to find a critical temperature for changes in viscosity, rheology measurements such as temp. sweep analysis and stress sweep are recommended. Within 2017, the OSCAR model will be upgraded with an improved module for prediction of spreading of oil in and oil spill, and in order to use this module the recommended rheology data will be required. The measurements would be performed on water free oil and emulsions prepared for dispersibility testing. 6) Ignitability: The ignitability of Rotterdam Diesel is recommended for comparison to the previously tested Marine diesel oils. Knowledge regarding the ignitability would be of importance in scenarios where burning would be the preferred counter measurement to a spill situation. Due to the lack of lighter components the HDME 50 oil is regarded as not ignitable and testing will not be included for this oil. The ULSFO oil contain lighter components and is recommended tested for ignitability. The testing would be performed on the fresh and weathered oil initially, followed by testing on emulsions of these fractions, if the fractions were found to be ignitable. Page 98 of 306
99 4 References 1. Daling, P. S., Brandvik, P. J., Mackay, D. and Johansen, Ø. (1990): "Characterisation of crude oils for environmental purposes." Oil & Chemical Pollution 7, 1990, pp Hokstad, J. N., Daling, P. S., Lewis, A. and Strøm-Kristiansen, T. 1993: "Methodology for testing water-in-oil emulsions and demulsifiers. Description of laboratory procedures." Proceedings Workshop on Formation and Breaking of W/O Emulsions. MSRC, Alberta June 14-15, 24 p 3. Mackay, D. and Zagorski, W "Studies of W/o Emulsions". Report EE-34: Environment Canada, Ottawa, Ontario. 4. Røyset, J.A., Personal communication. 5. Stiver, W. and Mackay. D "Evaporation rate of spills of hydrocarbons and petroleum mixtures." Environ, Sci. Technol., vol. 18 (11), pp Sørheim, K.R. and Daling, P.S., "Fysikalsk-kjemiska analyser og emulgerende egenskaper av ulike dieselkvaliteter". SINTEF rapport A 27122, ISBN: Page 99 of 306

100 A Experimental setup A.1 Oil samples and test temperature The oils were given the unique SINTEF IDs , and for HDME 50, Rotterdam Diesel and ULSFO, respectively. A.2 Small-scale laboratory testing To isolate and map the various weathering processes at sea, the oil was exposed to a systematic, stepwise procedure developed at SINTEF (Daling et al., 1990). The general procedure is illustrated in Figure 0-1. WOR: Water to Oil Ratio WOR=1: 50 vol.% water WOR=3: 75 vol.% water WOR=max: the maximum water content Figure 0-1: Small-scale laboratory weathering flow chart of oil A.2.1 Evaporation The density of the oil was monitored during the degassing. This was performed before evaporation by standard procedure. The evaporation procedure used is described in Stiver and Mackay (1984). Evaporation of the lighter compounds from the fresh oil was carried out as a simple one-step distillation to vapour temperatures of 250 C, which resulted in oil residues with an evaporation loss corresponding to approximately week of weathering on the sea surface. The residue is referred to as 250 C+. A.2.2 Physical and chemical analysis The viscosity, density, pour point and flash point of the fresh and water-free residues was analysed. In addition wax content and "hard" asphaltenes was measured for the 250 C+ residue. Viscosity for all the w/o emulsions was determined. The analytical methods used are given in Table 0-1 and Table 0-2. Table 0-1: Analytical methods used to determine the physical properties Physical property Analytical method Instrument Viscosity McDonagh et al, 1995 Physica MCR 300 Density ASTM method D Anton Paar, DMA 4500 Pour point ASTM method D97 - Flash point ASTM D Pensky-Martens, PMP1, SUR Interfacial tension (IFT) - Spinning drop video tensiometer SVT 20 N, Dataphysics Page 100 of 306
101 Table 0-2: Analytical methods used to determine the chemical properties Chemical property Analytical method Wax content Bridiè et al, 1980 Hard asphaltene IP 143/90 Chemical characterization by GC/FID and GC/MS The distribution of hydrocarbons (nc 5-nC 40) was analysed using a Gas Chromatograph coupled with a Flame Ionisation Detector (GC/FID). The Gas Chromatograph used was an Agilent 6890N with a 30m DB1 column. The analysis and quantification of PAHs, phenols and alkylated phenols (C 0-C 4) were completed using an Agilent 6890 Gas Chromatograph coupled with a, 5973 MSD detector (GC/MS) operating in SIM mode (Selected Ion Monitoring) The volatile components were in the range of nc 5-nC 10 and were quantified by use of PT-GC-MS (Purge and Trap Gas chromatograph Mass Spectrometer operating in full-scan mode, and using a modified version of the EPA 8260 analysis method) A.2.3 Emulsification properties The w/o emulsification studies were performed by the rotating cylinders method developed by Mackay and Zagorski (1982), which is described in detail by Hokstad et al,1993. The method includes the measuring of the following parameters: Relative water uptake (kinetics) Maximum water uptake Stability of the emulsion Effectiveness of emulsion breaker (Alcopol 60%) The principle of the rotating cylinders method is illustrated in Figure 0-2. Oil (30 ml) and seawater (300 ml) are mixed and rotated with a rotation speed of 30 rpm in separating funnels (0.5 L). The emulsification kinetics is mapped by measuring the water content at fixed rotation times. The maximum water content is determined after 24 hours of rotation. Figure 0-2: Principle of the rotating cylinder method Page 101 of 306


102 B Pictures from FET-Testing B.1 HDME 50 2 C HDME Fresh water-free The oil had solidified at the low temperature and application of oil into the cylinder was done by use of spatula. This provided some insecurity regarding to the total volume applied and consequently the dispersant-to-oil ratio (DOR). The oil appeared to disperse fairly well initially, but the dispersed oil rapidly resettled at the surface. The oil was deemed to have reduced dispersibility. Directly after mixing 1 minute after mixing 2 C - HDME Fresh MW (51.6%): Not dispersable. The emulsion has a very light colour so the effect might be better then estimated. IFP-testing is recomended for more exact results. Taking the colour in to consideration the HDME might be slightly dispersable - redused effect. The discolouration of the water is stabile and indicates that at least some of the emulsion is dispersed. After 2 minutes the larger oil-droplets have resurfaced, but the smaller dorplets are still dispersed. Directly after mixing. 2 minutes after mixing. Page 102 of 306

103 20 C HDME , Fresh water-free The oil dispersed very well, and the dispersed oil remained dispersed for a considerable time. Directly after mixing 1 minute after mixing 20 C HDME , Fresh, 50% Disperses well. Some of the oil resurfaces within the 2 minutes of stand still, but the emulsion was deemed to be dispersible. Directly after mixing. 2 minutes after mixing. 20 C - HDME , fresh, 75% Disperses well (similar to 50%). Page 103 of 306
: The oil/emulsion disperses well. There is little oil left on the surface.")

104 Directly after mixing. 2 minutes after mixing. s 20 C - HDME , Fresh, MW (76.9%): The oil/emulsion disperses well. There is little oil left on the surface. The colour of the emulsion makes it harder to determine the dispersability of the oil. After two minutes some of the dispersed oil has resurfaced. Directly after mixing. 2 minutes after mixing. Page 104 of 306
.")
105 B.2 ULSFO 2 C - ULSFO Fresh water free: The oil had solidified at the low temperature and application of oil into the cylinder was done by use of spatula. This provided some insecurity regarding to the total volume applied and consequently the dispersant-to-oil ratio (DOR). The oil was dispersed considerably more with applied chemical dispersant compared to without, but the dispersed oil resurfaced rapidly and the emulsion was deemed to have reduced dispersibility. Directly after mixing 2 C - ULSFO Fresh 50%: 1 minute after mixing Similar to the max-water of the same oil. Reduced dispersability. Higher DOR will probably give a better result. There is a lot of oil/emulsion left on the surface. NB! During the making of the emulsion the emulsion tube was conditioned at 2 C over night (with oil and seawater). This "froze" the oil on top of the water to a plug that did not move in the tube then rotation was started. To "compansate" for the long condition-time the tube was carefully heated with water until the plug was free to move in the tube during rotation. This means that some of the oil did not have the correct temperature at the start and that this emulsion might not be realistic. Directly after mixing. 2 minutes after mixing. Page 105 of 306
106 2 C - ULSFO Fresh MW (68,4%): Redused dispersability. Some of the emulsion disperses in to tiny droplets that are stabile in the water over time. Higher dosage of dispersant will probably give better effect. After 2 minutes some of the oil has resurfaced. Directly after mixing. 2 C - ULSFO MW (0%): 2 minutes after mixing. Not dispersable. The oil/emulsion is clearly below its pour-point. A cut-off syringe is used for application as the oil is to "thick" to go thru the tip. Directly after mixing. 1 minutes after mixing. Page 106 of 306

107 20 C - ULSFO , Fresh, water-free The oil dispersed well and remained dispersed for some time. Thus, the oil was deemed to be dispersible. 20 C - ULSFO , Fresh, 50% Disperses well and is stabile over the stability-period. There is allso good mixing of the oil and water in the blank, but this is very unstable. Directly after mixing. 2 minutes after mixing. 20 C - ULSFO , Fresh, 75% Disperses well, but there is still some oil left on the surface (well/reduced). The dispersed oil is stable over the stability-period. Page 107 of 306
108 Directly after mixing. 2 minutes after mixing. 20 C - ULSFO , Fresh, MW (91%) The oil/emulsion disperses well. There is little oil left on the surface. Similar result as , Fresh, MW. After two minutes the dispersion is stabile, little oil has resurfaced. Due to the high water-content of the emulsion the oil on the surface might be underestimated (relative to total amount applied). Directly after mixing. 2 minutes after mixing. Page 108 of 306
109 20 C - ULSFO , 250 C+, 50% Disperses well with litle resurfaceing during the stability-period. Directly after mixing. 2 minutes after mixing. 20 C - ULSFO , 250 C+, 75% Reduced dispersability. A lot of oil left on the surface after the mixing-period, and more resurfaces during the stability-period. Directly after mixing. 2 minutes after mixing. Page 109 of 306
110 20 C - ULSFO , 250 C+, MW (81.7%) Bad dispersability. There is some colour in the water, but most of the oil is still on the surface. Directly after mixing. 2 minutes after mixing. Page 110 of 306
111 SINTEF Ocean AS Address: Postboks 4762 Torgard NO-7465 Trondheim NORWAY Switchboard: Enterprise /VAT No: NO MVA Project memo Dispersibility of Shell ULSFO and HDME 50 Collection of project memos DATE AUTHOR(S) Kaja Cecilie Hellstrøm CLIENT(S) Kystverket (Norwegian Coastal Administation) CLASSIFICATION Unrestricted CLIENTS REF. Silje Berger NO. OF PAGES AND APPENDICES: 11 ABSTRACT The dispersibility of Shell ULSFO and HDME 50 was tested systematically with the use of the MNS and IFP methodologies. Six chemical dispersants were used in a screening study, and a dosage study was performed for each oil with four different dosage-to-oil ratios (DOR) ranging from 1:25 to 1:200. Dispersibility limits were found based on the emulsion viscosity and dispersibility effectiveness. PREPARED BY Kaja Cecilie Hellstrøm APPROVED BY Mimmi Throne-Holst Issued as part of report OC2017 A-123 Page 111 of 306
112 Table of contents 1 Introduction and method Method Screening of chemical dispersant and dosage testing Screening and dosage study of dispersants Dosage study Dispersibility limits ULSFO HDME Conclusion Page 112 of 306
113 1 Introduction and method A dispersibility study was performed in order to document the relative effect of chemical dispersants on emulsions with various degrees of weathering of the Shell ULSFO and HDME 50 oils. The tests were performed at 13 C, a temperature typical for summer conditions in the North Sea. A screening of six different chemical dispersants was conducted, and a dosage testing was performed on the chemical dispersant deemed most relevant, Dasic NS. In addition, further dispersibility testing was necessary in order to produce a basis for estimating the window of opportunity for use of chemical dispersants, in accordance with regulated procedure for testing of dispersant effectiveness. Both low-energy IFP-testing and high-energy MNS testing were used in the study, as these tests provide insight to the dispersibility at different weather conditions. 1.1 Method Several laboratory techniques exist for the testing the effectiveness of chemical dispersants. The results from these different methods vary mainly due to different levels of energy applied on the tests. SINTEF uses the IFP and MNS methods for standardized testing and estimation of window of opportunity for use of chemical dispersants. These methods are used in agreement with current Norwegian regulations. IFP (Institute Francais du Petrole test, Bocard et al., 1984) is also used for approval of chemical dispersants in France. IFP is a low-energy test, representing non-breaking wave conditions, and has natural dilution in the water column implemented in its setup. The test is considered to be closer to represent a realistic approximation to a field trial compared to other test methods. A schematic view of the IFP test is shown in Figure 1-1. Figure 1-1: IFP test setup The MNS test (Mackay and Szeto, 1980) uses air blown over the oil/water surface in a circular container to create a wave that is estimate to equal breaking wave conditions. Unlike the IFP method, natural dilution is not implemented in the setup, which is shown schematically in Figure 1-2. Page 113 of 306
114 Figure 1-2: MNS test setup To summarize, the dispersibility testing included: Screening of six different dispersants with the IFP method to find the best and relevant dispersant for the ULSFO and HDME 50 oils. Dosage testing of the best/relevant dispersant. Systematic dispersant study with the dosage rate 1:25 (DOR - Dispersant to Oil Ratio), in order to determine the time window for effective dispersant use on the ULSFO and HDME 50 oil in a spill scenario. Page 114 of 306
115 Effectivness % 2 Screening of chemical dispersant and dosage testing 2.1 Screening and dosage study of dispersants A screening study was performed using the low energy test (IFP) to investigate the effectiveness of six different dispersants. The results for the screening of ULSFO and HDME 50 are presented in Table 2-1 and shown in Figure 2-1. The results from the IFP-tests for ULSFO show that Dasic NS had the highest effectiveness along with Corexit The screening of the same six dispersants using emulsions of HDME 50 showed lower effectiveness compared to the results for ULSFO. Of the tested dispersants, Radiagreen had the highest effectiveness on HDME 50 while Dasic NS had the second highest effectiveness. Table 2-1: Screening test on emulsions of ULSFO (1336 mpa s, 10 s -1 ) and HDME 50 (4789 mpa s, 10 s - 1 ) using the IFP- tests, at 13 C Dispersant (DOR 1:25) Effectiveness of dispersant (Fresh oil, 50 vol. % W/O emulsion) ULSFO HDME 50 Corexit Dasic NS Finasol OSR Gamlen OD Superdispersant 23 2 Radiagreen Screening with IFP HDME 50 ULSFO Figure 2-1: Results from screening of six chemical dispersants on HDME 50 and ULSFO, performed at 13 C 2.2 Dosage study Dasic Slickgone NS is the main dispersant in stock in Norway and was chosen for further dosage testing and dispersibility testing. Four dosages of Dasic NS were tested on similar emulsions as used for the screening testing, made from fresh oil and containing 50 vol. % sea water. The dosages were 1:25, 1:50, 1:100 and 1:200 DOR (Dispersant to Oil Ratio), of which the 1:25 dosage had already been tested during the screening. The results of the dosage study are presented in Table 2-2 and Table 2-3 for ULSFO and HDME 50, respectively. The results for the two oils from testing with the IFP and MNS methods are compared in Figure 2-2 and Figure 2-3, respectively. Page 115 of 306
116 Effectiveness % Table 2-2: Dosage rate testing on ULSFO using the IFP-and MNS-test at 13 C and the 50 vol. % water and fresh oil emulsion Dispersant (dosage rate) Effectiveness of dispersant on fresh oil/50 vol. % emulsion Viscosity (mpa s) 10 s -1, 13 C IFP MNS Dasic NS (1:25) Dasic NS (1:50) Dasic NS (1:100) Dasic NS (1:200) ULSFO expressed clear dosage dependent effectiveness for the IFP test but less significant dosage dependence for the MNS test. This indicate that lower dispersant dosages can be used in breaking wave conditions and provide the same or very similar effectiveness as higher dosages. For HDME 50 the effectiveness of the dispersant is strongly dosage dependent for both the IFP and MNS test, and in general showed low effectiveness for the IFP test. Breaking wave conditions might be required for successful dispersion of this oil; alternatively, additional energy may be applied through use of MOB boats or Fi-Fi systems. Table 2-3: Dosage rate testing on HDME 50 using the IFP and MNS-test at 13 C, using a 50 vol. % water emulsion made from fresh oil. These IFP and MNS tests were performed on two different emulsions, and the respective emulsion viscosities are provided for each test. Dispersant (dosage rate) Effectiveness of dispersant on Fresh/50 vol. % emulsion IFP Viscosity (mpa s) 10 s -1, 13 C MNS Dasic NS (1:25) Dasic NS (1:50) Dasic NS (1:100) Dasic NS (1:200) Viscosity (mpa s) 10 s -1, 13 C 100 IFP HDME 50 ULSFO :25 1:50 1:100 1:200 DOR (Dosage to Oil Ratio) Figure 2-2: Results from dosage testing with the IFP method for both HDME 50 and ULSFO, performed at 13 C Page 116 of 306
117 Effectiveness % 100 MNS HDME 50 ULSFO :25 1:50 1:100 1:200 DOR (Dosage to Oil Ratio) Figure 2-3: Results from the dosage testing with the MNS method for both HDME 50 and ULSFO, performed at 13 C Page 117 of 306
118 3 Dispersibility limits Further dispersibility testing was performed on emulsions containing different volume per cent of water. Emulsions made from the artificially weathered 250 C+ residue of ULSFO was also included to provide a wider basis for the estimation of a viscosity limit for dispersibility. The dispersibility limits were estimated based on the effectiveness of Dasic NS on the tested emulsions of oils, more specifically on the effectiveness of the dispersant relative to the viscosities of the emulsions. Figure 3-1 and Figure 4-1 show the effectiveness in % relative to the viscosities and also depict how the dispersibility limits were estimated. The dispersibility limits are used for determining a "window of opportunity" for use of chemical dispersants in an acute event. 3.1 ULSFO The results from the dispersibility testing of ULSFO are presented in Table 3-1, and show in general low effectiveness for the weathered residue and its emulsions with both the IFP and MNS test. The dispersibility of emulsified fresh oil was higher than for the water-free residues. There was also a higher effectiveness with the MNS test compared to the IFP test for the fresh oil emulsions. The low effectiveness can be explained by the high viscosity and high pour point of ULSFO and its weathered residue (250 C+). The pour point of the fresh oil and the residue were 24 and 30 C, respectively, and at 13 C both are likely affected by the formation of stable wax lattices, the weathered residue more strongly so than the fresh oil. This wax lattice formation will have influenced on the viscosity of the water free fractions, and result in high viscosities. When water is mixed into the oil, this contribute to break down the lattice structure and result in a reduced viscosity compared to the water-free fraction. As more water is mixed into the emulsion, the viscosity may begin to rise again, as usually seen with emulsification. Looking at viscosities measured at share rate of 10 s -1, such initial decrease and subsequent increase in viscosity was seen for the fresh oil, but not for the weathered fraction where only a decrease in viscosity was observed. Figure 3-1 show the results and dispersibility limits set for ULSFO, and Table 3-2 list these dispersibility limits. The results indicate that emulsions with viscosities below 4000 mpa s can be considered chemically dispersible, while emulsion viscosities above 9000 mpa s indicate that application of chemical dispersibility will not yield a good effect. With an original viscosity of 4300 mpa s, fresh ULSFO can be considered to have reduced dispersibility if spilled to the sea surface, but may be expected to obtain viscosities that will respond well to chemical dispersants shortly after being spilled, as emulsification begins. list these dispersibility limits. The results indicate that emulsions with viscosities below 4000 mpa s can be considered chemically dispersible, while emulsion viscosities above 9000 mpa s indicate that application of chemical dispersibility will not yield a good effect. With an original viscosity of 4300 mpa s, fresh ULSFO can be considered to have reduced dispersibility if spilled to the sea surface, but may be expected to obtain viscosities that will respond well to chemical dispersants shortly after being spilled, as emulsification begins. Table 3-1: Efficiency of dispersant on emulsions from fresh and weathered ULSFO, at 13 C Residue Water content Viscosity (mpa s) Viscosity (mpa s) Effectiveness (%) Effectiveness (%) (vol. %) 10 s s -1 IFP MNS Fresh C Fresh C ,7 2 Fresh Fresh C Page 118 of 306
119 Table 3-2 Estimated viscosity limits for use of dispersant for ULSFO emulsion and the criteria for definition of time window Dispersibility Criteria (wt. %) Dispersibility limits (mpa s = cp)* Chemically dispersible IFP efficiency > 50 % 4000 Not chemically dispersible MNS efficiency 5 % 9000 * Estimated limits are based on the dispersibility data from both the low energy IFP-test and the high energy MNS-test Figure 3-1: Effectiveness of use of chemical dispersant relative to emulsion viscosity, and dispersibility limits set for ULSFO 4 HDME 50 The basis for estimation of dispersibility limits for the HDME 50 consisted of fewer tests compared to ULSFO since no artificial residue was produced through evaporation and all emulsions were made from the fresh oil. A lower maximum water uptake also limited the total number of emulsions used in the dispersibility testing that forms the basis for the estimation. HDME 50 produced stable emulsions with up to 68 vol. % water. The viscosities of the emulsions correlated with the water content, with a constant increase in viscosity with higher water content. The effectiveness of the chemical dispersant Dasic NS was low for the IFP test regardless of the water content. Higher effectiveness was seen when using the MNS test, though the effectiveness was lower with higher water content. The results show that energy may be required for successful dispersion of the oil, in calm conditions additional energy may be applied through the use of MOB boats or FI-FI systems. Due to the low effectiveness for the IFP-test, the dispersibility limit has been based on the 75 % effectiveness with the MNS test. Based on the results, a limit for reduced dispersibility has been estimated for emulsions with viscosities below 3000 mpa s. In calm conditions, the oil can be considered to have reduced dispersibility unless additional energy can be applied. An upper viscosity limit where chemical dispersants have little or no effect with either the IFP or MNS method was not established. Significant, though low, dispersibility was seen for all tested emulsions. Page 119 of 306
120 Table 4-1: Efficiency of dispersant on emulsions of HDME 50 at 13 C Residue Water content Viscosity (mpa s) Viscosity (mpa s) Effectiveness (%) Effectiveness (%) (vol. %) 10 s s -1 IFP MNS Fresh Fresh Fresh Fresh Emulsions were not possible to make, no results were obtained Table 4-2: Estimated viscosity limit for use of chemical dispersant on emulsions of HDME 50, with criteria for definition if time window Dispersibility Criteria (wt. %) Dispersibility limits (mpa s = cp)* Chemically dispersible MNS efficiency > 75 % 3000 Not chemically MNS efficiency 5 % N.A. dispersible * Estimated limits are based on the dispersibility data from both the low energy IFP-test and the high energy MNS-test Figure 4-1: Effectiveness of use of chemical dispersant relative to emulsion viscosity, and dispersibility limits set for ULSFO Page 120 of 306
121 5 Conclusion ULSFO was seen to form stable emulsions with lower viscosities (measured at share rate of 10 s -1 ) compared to the water free oil measured with the same share rate, with the exception of emulsions saturated with water (max. water emulsions). The reduction in emulsion viscosity was reflected in an increase in the dispersibility of the oil, and the emulsions with the lowest viscosities dispersed well when with both the IFP and MNS method. The estimated window of opportunity for ULSFO show that the oil and its emulsions will be dispersible when viscosities are below 4000 mpa s, and have reduced dispersibility between mpa s. Emulsions with viscosities higher than 9000 m Pas are deemed not dispersible, even with the high energy MNS test. The reduction of viscosity when the oil obtain water is typical for heavy fuel and/or waxy oils. The initial reduction of viscosity with uptake of water may increase the dispersibility of the oil and prolong the window of opportunity, but this effect will likely not persist over a long time. HDME 50 consist of a heavy distillation cut and could not be artificially weathered to form residues, and only emulsions formed from the fresh oil were used for the dispersibility testing. The oil formed stable emulsions, which had higher viscosities with increased water content. The results from this dispersibility study show that HDME 50 has in general reduced dispersibility at calm wave conditions (< 30 % effectiveness) and also experience reduced dispersibility at breaking wave conditions when emulsion viscosities exceed 3000 mpa s, as the effectiveness of the high-energy MNS test is expected to be below 75 %. The oil shows low dispersibility in low-energy conditions, and addition of energy, through use of MOB-boat or Fi-Fi systems may enhance the dispersant effectiveness in such scenarios. The obtained dispersibility results did not provide enough data for a robust estimation of an upper viscosity limit above which the oil/emulsion would be considered poorly dispersible. However, the results from this bench-scale dispersibility study indicate that the oil and its emulsions may be considered not dispersible if viscosities surpass mpa s, though this limit may be conservative. The very high wax content of ULSFO (13.1 wt. %) and high wax content of HDME 50 (9.5 wt. %), and their correspondingly high pour points (24 C and 12 C, respectively), can make solidification an issue for the dispersion of these oils. For ULSFO, this may be an issue even at relatively high temperatures. Solidification can prevent the oil spill dispersant from soaking into the oil, and the dispersants may remain as a layer on top of the solidified oil and can easily be washed away by waves. Similar behaviour can be observed for very viscous oils. The effectiveness of application of dispersant is expected to be higher with warmer temperatures, since the oil/emulsion viscosities will be lower, and solidification less likely, allowing the dispersant to soak into the oil. Page 121 of 306
122 SINTEF Ocean AS Address: Postboks 4762 Torgarden NO-7465 Trondheim NORWAY Switchboard: Enterprise /VAT No: NO MVA Project memo Meso-scale testing of HDME 50 and Shell ULSFO DATE AUTHOR(S) Kaja Cecilie Hellstrøm CLIENT(S) Kystverket (Norwegian Coastal Administation) CLASSIFICATION Unrestricted CLIENTS REF. Silje Berger NO. OF PAGES AND APPENDICES: 31 ABSTRACT Meso-scale flume experiments were conducted for both HDME 50 and Shell ULSFO at 2 C and 13 C, representing winter and summer conditions. This memo provide the detailed results and observations made during these tests. PREPARED BY Kaja Cecilie Hellstrøm APPROVED BY Mimmi Throne-Holst Issued as part of report OC2017 A-123 Page 122 of 306
123 Table of contents 1 Introduction Meso-scale experiments with Shell ULSFO and HDME HDME HDME 50, 13 C Meso-scale flume results compared with OWM predictions for HDME 50 at 13 C HDME 50, 2 C Meso-scale flume results compared with OWM predictions for HDME 50 at 2 C HDME 50 at different temperatures SHELL ULSFO SHELL ULSFO, 13 C Meso-scale flume results compared with OWM predictions for SHELL ULSFO at 13 C SHELL ULSFO, 2 C Meso-scale flume results compared with OWM predictions for SHELL ULSFO at 2 C SHELL ULSFO at different temperatures Evaluation of SHELL ULSFO and HDME APPENDICES "[List appendices here]" Page 123 of 306
124 1 Introduction Hybrid fuel oils are products designed to have favourable properties from both heavy and light fuel types but still be suited for use in engines designed for heavy fuel oils. This new category of oil has recently become available in 2015, as a result of the new Marpol regulations limiting sulphur content of fuel oils. The sulphur content of hybrid fuel oils is usually below the limits set for the Sulphur emission control areas (SECA) which is presently 0.1 % m/m Sulphur inside SEC areas. Similar oil types will likely become more common in years to come when stricter limits for sulphur emission will be enforced in 2020, when a limit of 0.5 % sulphur will be enforced outside Sulphur Emission Control Areas (SECA) (present limit is 3.5 % m/m). SINTEF has investigated the physical and chemical properties of two hybrid fuel oils, HDME 50 and SHELL ULSFO. The aim has been to obtain sound information regarding the weathering properties and toxicities of these two oils and DMA fuel types, as well as assessing the potential for use of chemical dispersants as a response operation. Bench-scale studies have been performed for assessment of the emulsifying properties, dispersibility, and toxicity and ignitability of the oils (see separate memos). This memo describe the meso-scale flume tests that have been performed on HDME 50 and SHELL ULSFO in order to simulate weathering of the oils at temperatures common in marine areas near Norway and the Arctic. The meso-scale laboratory testing give valuable operational information about the oil's behaviour under conditions that allow weathering processes to occur simultaneously, and the flume testing is therefore a good supplement to the small-scale testing. 1.1 Meso-scale experiments with Shell ULSFO and HDME 50 Four meso-scale flume experiments were conducted on the hybrid fuel oils SHELL ULSFO (Ultra Low Sulphur Fuel Oil) and HDME 50 (Heavy Distillate Marine ECA) as a part of the project Hybrid Fase II. Both oils were tested at two temperatures, 2 and 13 C, in order to study the behaviour of the oils at different temperatures. The results are presented according to oil type, with a comparison of behaviour at the two temperatures for each oil, and a concluding comparison of the two oils. The four experiments were conducted using the standardised energy settings representing breaking wave conditions. This energy setting is used as a standard energy setting in meso-scale oil weathering studies. All four experiments were run for 72 hours before applications of chemical dispersant was performed. An outline and summary of the four experiments is given in Table 1-1. Dosages of applied dispersants are given in both Dispersant to Oil Ratio (DOR) and Dispersant to Emulsion Ratio (DER). DOR is given in both % and relative ratio, while DER is given in relative ratio. All dosages are listed per application and as total dosage. Page 124 of 306
125 Table 1-1: overview of parameters for the four performed meso-scale flume tests Parameter Experiment no Oil type HDME 50 SHELL ULSFO HDME 50 SHELL ULSFO SINTEF-ID Week/year 41/ / / /2016 Temperature Litres of oil applied Simulated sun light yes yes no no Dispersant Dasic NS Dasic NS Dasic NS Dasic NS Dosage (g) =620 g =413 g =265 g =118 g Dosage (DOR %)* =9.8 % = 9.1 % = 5.2 % =8.9 % Dosage (DOR)* 1:20+1:30+1:60 =1:10 1:42+1:46+1:22 = 1:11 1:53+1:38+1:150 = 1:19 1:23+1:22=1:11 Dosage (DER)* 1:53+1:79+1:153= 1:26 1:248+1:271+1:130= 1:65 1:79+1:57+1:226 = 1:29 1:56+1:54=1:28 No. of applications of Dasic NS Evaluation of efficiency of dispersant Reduced effectiveness Poor effectiveness Good effectiveness** Reduced effectiveness** *all dosages were calculated based on the amount of oil and emulsion available before the first application of chemical dispersant **Waxy lumps remain on surface 2 HDME 50 HDME 50 is a hybrid oil that consist of a heavy distillation cut and is refined in Rotterdam, the Netherlands, for Exxon. HDME 50 is presently the hybrid oil most commonly used both internationally and in Norwegian waters. 2.1 HDME 50, 13 C The experimental results obtained for HDME 50 in the meso-scale laboratory test at 13 C is presented below. In Page 125 of 306

126 , the test data are given along with various measurements done during the tests. The mass balance and efficiency of use of chemical dispersant is also presented. When applied to the water surface the oil emulsified rapidly and a significant change in colour was observed. Very little oil was seen to be mixed down into the water phase; the oil remained on the surface where some oil adsorbed to the flume walls. The forming emulsion quickly became thicker and was seen to have large pockets of water in it. The change in colour and the presence of water pockets in the emulsion can be seen in Figure 2-1. The pour point of HDME 50 has previously been measured to be 12 C, and may have influenced the behaviour of HDME 50 at 13 C. In this temperature range, formation of wax lattice structures may begin, and this may influence the viscosity when measured at a low share rate, and influence the ability for dispersants to soak into the oil. Figure 2-1: Emulsion formed after application of oil (left, 0 hr) and pockets of water in the emulsion (right, 2 hr) Over time, the emulsion viscosity appeared to increase and the colour changed to a lighter brown colour. The observed behaviour regarding viscosity was confirmed through analysis, and the results presented in Table 2-1 show an early viscosity of 6864 mpa s after 30 min and a final viscosity of mpa s (before application of dispersant). Samples of the water taken 30 minutes after initiation of the experiment appeared to be clean and did not indicate natural dispersion, and only 2.6 ppm of oil was measured in this sample. Other water samples taken during the first day were not analysed for oil content since these water samples showed no sign of significant change in natural dispersion. The water samples taken after 48 and 72 hours showed a small increase in the amount of oil in the water phase, with 19.2 and 40.5 ppm, respectively, approximately 3 % dispersion. After 6 hours in the flume, the emulsion had become smoother and obtained a lighter brown colour than previously. Pockets of water in the emulsion was still seen in the emulsion after 12 hours, and after 48 hours in the flume, the thick emulsion had aggregated in front of the wave machine and stuck together preventing a circular flow of the emulsion in the flume. In order to allow flow around the flume, movement of the emulsion had to be forced. This was done by fixing a piece of a hose, functioning as a stirring pin, to a stirrer and lowering this into the water. By using this contraption the emulsion was forced around the flume once more. The contraption can be seen in Figure 2-2. Page 126 of 306

127 Figure 2-2: Contraption created to promote flow of emulsion around the flume. After 72 hours, water pockets were still visible in the emulsion and the emulsion did not seem to have change much during the last 2 days of testing. Dasic NS was applied after three days of testing in the flume. The dosage of dispersant was set based on an estimation of the amount of oil remaining on the water surface (nearly all oil was assumed to be present on the water surface, with the exception of some oil that was adsorbed to the flume walls). 309 g of dispersant was applied and this gave a DOR (Dosage to Oil Ratio) of 1:20, corresponding to a DER (Dosage to Emulsion Ratio) of 1:53. The emulsion was measured to have a water content of 61 vol. % prior to dispersion. During the first half hour after the first dispersion, the emulsion appeared to break up and more oil was mixed into the water. The emulsion changed to a creamier consistency, and spread over a larger surface area. At the same time, fewer pockets of water was observed in the emulsion. A second application of dispersant consisting of 205 g (DOR = 1:30, DER = 1:79) increased the mixing of oil into the water further. The emulsion was seen as flat and stringy near the wave, and the wave pushed much of the emulsion down into the water as larger droplets that rapidly resurfaced. Similar behaviour was observed after the third and final application of chemical dispersion which consisted of 106 g (DOR = 1:60 and DER = 153). The three applications of Dasic NS summed up to 620 g corresponding to a DOR of 1:10, and DER of 1:26. Repeated application of chemical dispersant was required for good dispersion of the emulsion (> 50 % effectiveness), which only occurred after the third application. The application of chemical dispersant occurred at approximately 30 minutes intervals. The mass balance of the experiment is seen in Figure 2-4, and show low evaporation and dispersion, and some adsorption to the flume walls. Page 127 of 306
, emulsion prior to dispersion (middle, 72 hr)")
 Figure 2-4: Mass balance")

128 Figure 2-3: Lighter coloured emulsion (left, 6 hr), emulsion prior to dispersion (middle, 72 hr) and after the second application of dispersion (right, 72 hr + 2 disp) Figure 2-4: Mass balance of the flume experiment with HDME 50 performed at 13 C, before application of chemical dispersant Page 128 of 306

129 Figure 2-5: Effectiveness of chemical dispersion on emulsion of HDME 50 after 72 hours of weathering in meso-scale flume at 13 C Page 129 of 306
130 Table 2-1 results from the meso-scale weathering experiment of HDME 50 at 13 C Sample no. Time Water content Evaporative loss Viscosity Oil in water (hours) (vol. %) (wt. %) (mpa s), 10 s -1 ppm* st application of dispersant: 309 g Dasic NS (DOR = 1:20, DER = 1:53) 3 min. after disp min. after disp min. after disp nd application of dispersant: 205 g Dasic NS (DOR= 1:31, DER = 1:79) Total of 1 st and 2 nd application: 514 g Dasic NS (DOR = 1:12, DER =1:32) 3 min. after disp min. after disp min. after disp rd application of dispersant: 106 g Dasic NS (DOR= 1:60, DER = 1:153) 10 min. after disp min. after disp min. after disp Total amount of applied chemical dispersant: 620 g Dasic NS (DOR = 1:10, DER = 1:26) - No measured data * ppm = parts per million Meso-scale flume results compared with OWM predictions for HDME 50 at 13 C Measured emulsion viscosities compared to predicted emulsion viscosities are shown in Figure 2-6, while a comparison of measured and predicted evaporative loss is shown in Figure 2-7. Figure 2-8 show a similar comparison of measured and predicted water content in emulsion. The measured emulsion viscosities were in general higher than the predicted emulsion viscosities, which predicted the emulsion viscosities would not surpass mpa s (approximately). The results from the meso-scale testing show that a continued increase in emulsion viscosity can be expected for at least the first three days of weathering, and that emulsion viscosities can surpass mpa s. Little evaporative loss was expected for HDME 50 since it consist of a heavy distillate cut. Both the measured and predicted evaporative loss, as seen in Figure 2-7, support this expectation. The measured and predicted water uptake correspond well as observed in Figure 2-8, though the measured water content show a slightly different behaviour than predicted, with a continuous water uptake throughout the test period rather than the rapid increase to a maximum water content the predictions indicate. The higher measured emulsion viscosity may prevent mixing of water into the oil, resulting in a slower measured water uptake and may explain some of the difference between the predictions and the measured results. Due to a lack of an artificially weathered residue, limited data were available for HDME 50 for use as input to the OWM. For this reason, the measured results and observations made during the flume experiment are considered more accurate for the expected behaviour of HDME 50. Page 130 of 306
131 Figure 2-6: Show the emulsion viscosity measured during the meso-scale flume testing at 13 C compared to predicted emulsion viscosities at 15 C for HDME 50 Figure 2-7: Show the measured versus predicted evaporative loss of HDME 50 Page 131 of 306
132 Figure 2-8: Measured water content in emulsion compared to predicted water uptake for HDME 50 Page 132 of 306


133 2.2 HDME 50, 2 C When applied to the water surface, HDME 50 solidified immediately at 2 C as seen in Figure 2-9, and large brown lumps with an uneven structure was formed. The pour point of HDME 50 was 12 C, and solidification was thus not unexpected at 2 C. Emulsification occurred slowly on the surface of the lumps, the first signs of emulsion were seen after one hour and continued to form during the 72 hours of testing. Figure 2-9 show the lumps that formed initially, and the emulsion that had formed on these waxy lumps after 4 hours. Over time, the emulsion moved from the surface of the lumps of oil to the water surface and patches of emulsion with waxy oil lumps were seen after 12 hours. The emulsion had a light brown colour while the lump underneath the layer of emulsion kept the original dark brown colour seen at application of oil to the surface. No natural dispersion was observed during the first 72 hours of testing, and a limited number of water samples were analysed. The emulsion stuck to the flume walls, and caused un-emulsified oil lumps to be temporarily stuck to the walls. The patches of emulsion seen after 12 hours, melted together to a slick of emulsion with waxy lumps floating within the patches. The waxy lumps broke into smaller pieces over time, which promoted further formation of emulsion. A slight change in colour was seen in the emulsion with time, from light brown to a lighter yellowish brown, and some pockets of water was observed during sampling throughout the testing. The maximum water content of the emulsion was measured to 33 vol. %, after 72 hours of testing. The water content of the emulsion was found to decrease with the application of chemical dispersant. The viscosity of the emulsion appeared to decrease during the experiment, and the measured emulsion viscosities confirm this observation. Measurements showed a decrease of viscosity from mpa s after 4 hours to mpa s after 72 hours. Samples of emulsion, waxy lumps and a mixture of the emulsion and smaller wax lumps were taken after 24, 48 and 72 hours after initiation. The water phase remained clear throughout testing previous to application of chemical dispersant, and after 72 hours, the cooling system was easily visible from the surface (through 1 m water column), as show in Figure After 72 hours, 5.1 L of the 8.1 L applied oil was assumed to remain on the water surface. The missing 3 L were lost through adsorption to the flume wall and sampling. The remaining 5.1 L of oil was measured to have a water content of approximately 33 vol. % summing up to 7.7 L of emulsion. Figure 2-9: immediate solidification (right, 0 hr) and emulsification on surface of waxy lumps (right, 4 hr) Application of chemical dispersant had an almost immediate effect. The water became opaque with the oil that was mixed into the water, while the emulsion became slightly lighter in colour and seemed to drop in viscosity. Threads of emulsion was mixed into the water by the energy from the wave machine but resurfaced again within a short space of time. Repeated application of dispersant appeared to enhance the dispersion. Though the formed emulsion seemed to disperse to a certain degree, the waxy lumps remained on the water surface and was not affected by the chemical dispersant. 2 hours after the third and final application of chemical dispersant, a significant amount of emulsion still remained on the water surface along with the remaining waxy lumps. Approximately 850 g of waxy lumps were collected from the surface after the experiment was ended, which correspond to a volume of 940 ml of fresh oil. Page 133 of 306


134 Figure 2-10: emulsion with wax lumps prior to dispersion (left, 72 hr) and emulsion after second dispersion (right, 72 hr + 2 disp) No significant evaporation was measured during the experiment, and the slightly higher amount of oil found in the first water sample compared to the last water sample before application of chemical dispersant result in a calculated decrease in the mass balance for dispersed oil. The mass balance seen in Figure 2-11 also reflect the amount of emulsion that absorbed to the flume walls, and after 72 hours approximately 60 % of the original amount of oil was available for dispersion. The effectiveness of chemical dispersion is seen in Figure 2-12 below, and indicate little effect from the first round of dispersion. However, the emulsion viscosity was reduced from mpa s to mpa s after the first round of dispersion (DOR=1:53, DER=1:79), an effect that may have enhanced the effectiveness of the second application of chemical dispersant. The results from the second (DOR = 1:38, DER = 1:57; cumulative 1 st +2 nd : DOR = 1:22 and DER = 1:33) and third (DOR = 1:150, DER = 1:226, cumulative for all applications DOR = 19, DER = 1:29) application show varying results, likely caused by the presence of larger oil/emulsion droplets in some of the water samples. Nevertheless, repeated application of chemical dispersant resulted in higher effectiveness compared to the effectiveness from one application only. The average effectiveness after the first application of chemical dispersant was 14 %, while for the second and third application the effectiveness was 59 and 64 %, respectively. The DOR and DER are calculated based on the volume of oil available for dispersion after 72 hours of testing. However, the dosage (g) of Dasic NS were estimated based on the assessed volume of emulsion remaining between applications. Page 134 of 306

135 Figure 2-11: Mass balance of the flume experiment with HDME 50 performed at 2 C, before application of chemical dispersant Figure 2-12: Effectiveness of application of chemical dispersant on emulsion of HDME 50 after 72 hours of weathering in meso-scale flume at 2 C Page 135 of 306
136 Table 2-2: results from the meso-scale weathering experiment of HDME 50 at 2 C Sample no. Time (hours) Water content (vol. %) Evaporative loss (wt. %) Viscosity (mpa s), 10 s -1 Oil in water ppm* st application of dispersant: 97 g Dasic NS (DOR = 1:52, DER = 1:79) 3 min. after disp min. after disp min. after disp nd application of dispersant: 134 g Dasic NS (DOR = 1:38, DER = 1:57) Total of 1 st and 2 nd application: 231 g Dasic NS (DOR = 1:22, DER = 1:33) 3 min. after disp min. after disp min. after disp * rd application of dispersant: 34 g Dasic NS (DOR= 1:150, DER = 1:226) 3 min. after disp min. after disp min. after disp min. after disp Total amount of applied chemical dispersant: 265 g Dasic NS (DOR = 1:19, DER = 1:29) - No measured data * ppm = parts per million Meso-scale flume results compared with OWM predictions for HDME 50 at 2 C The measured values for emulsion viscosity, evaporative loss and water content have been compared to predicted values for these properties. Figure 2-13 show the predicted and measured viscosity. The predicted emulsion viscosities are similar to the measured emulsion viscosities for the first 48 hours. After 72 hours, the measured emulsion viscosity was lower than the predictions. Both the predicted and measured emulsion viscosities show a similar trend; the emulsion viscosities decrease over the first days. The high emulsion viscosities measured for HDME 50 at 2 C are likely caused by solidification of the oil, due to the high pour point of 12 C. When viewed in connection to the water content of the emulsion, as seen in Figure 2-15, the decrease in emulsion viscosity correspond with an increased water content between 12 hours and 1 day after initiation. The predicted water uptake also correspond well with the measured water content from the mesoscale flume testing. The evaporative loss of HDME 50, seen in Figure 2-14, was both measured and predicted to be very low. Page 136 of 306

137 Figure 2-13: Measured emulsion viscosity compared to predicted emulsion viscosities at winter temperatures for HDME 50 Figure 2-14: Evaporative loss as measured and predicted for HDME 50 at winter temperatures Page 137 of 306
138 Figure 2-15: Predicted water content in emulsion compared to measurements from the flume test on HDME 50 at winter temperatures 2.3 HDME 50 at different temperatures The properties of HDME 50 varied between the test temperatures. Due to a relatively high pour point (12 C) of the oil, the oil solidified immediately upon application to the water at 2 C, but not at 13 C. At 13 C emulsification began immediately but little oil was mixed into the water. The emulsion that formed at 13 C was more or less homogenous while at 2 C the emulsion formed on the surface of waxy lumps, and these lumps remained in the emulsion throughout the test period. It may be that the emulsion that formed at 2 C therefor had a lower content of wax, due to the formation of a stable wax lattice in the lumps, trapping wax within the lumps. The development of emulsion viscosity also varied between the tests. At 13 C a continuous increase in emulsion viscosity was seen from start (6264 mpa s) until 72 hours after initiation (20232 mpa s). A decrease in emulsion viscosity was seen after application of chemical dispersant at this temperature. At 2 C, the emulsion viscosity varied, showing signs of initial increase followed by a significant decrease in viscosity between 4 and 72 hours after start. Application of chemical dispersion did not result in the same drastic reduction in emulsion viscosity, but a decrease was observed after the first application of dispersant. The effectiveness of chemical dispersant was also somewhat different between the test temperatures. At both temperatures, repeated application of chemical dispersant had effect, at 2 C a good effect was seen after the second application, while at 13 C three applications of dispersant was necessary for a good effect to occur. At 2 C, waxy lumps remained present on the water surface throughout dispersion, but at 13 C the emulsion was homogenous and did not contain wax lumps. A lower dispersibility limit for expected reduced effectiveness of chemical dispersant has been set at 3000 mpa s based on the bench-scale dispersibility testing performed at 13 C. An upper dispersibility limit of mpa s was estimated as a limit for poor dispersibility. Prior to dispersion in the flume tests, the emulsion viscosities were well above this estimated upper limit for dispersion for both the 2 C test and the 13 C test. However, a significant reduction in emulsion viscosity after the first application of dispersant in the 13 C test gave viscosities intermediate of the lower and upper Page 138 of 306
139 viscosity limit, and some dispersion would be expected. At 2 C the emulsion viscosities remained well above the mpa s limit, even though a reduction in viscosity occurred. At 2 C, waxy lumps remained on the water surface even though the emulsion was successfully dispersed. In a spill event such waxy lumps will require mechanical recovery for removal from the sea surface. The emulsion viscosities of HDME 50 were well above the viscosity limit for expected boom leakage (1000 mpa s). The highest measured emulsion viscosity from the flume tests had a viscosity of mpa s. Regular weir skimmers may be used but one can experience some reduced recovery rate at the highest viscosities. The following conclusions have been made based on the results from the performed flume testing. The behaviour of HDME 50 is temperature dependent and solidification can be an issue at low temperatures o Emulsification occurred at both test temperatures but was seen to happen more slowly at lower temperatures o Waxy lumps remained within the emulsion at both temperatures but were larger at lower temperatures. o The development of the emulsion viscosities varied between temperature The dispersibility of HDME 50 was in general poor. o Repeated application of dispersant may reduce the emulsion viscosity and enhance the dispersion. o The emulsion formed at 2 C dispersed better with a lower DOR compared to the emulsion formed at 13 C o Waxy lumps remained on water surface after dispersion of emulsion at both test temperatures, but more significantly at 2 C Page 139 of 306

140 3 SHELL ULSFO SHELL ULSFO is produced in the Netherlands and consist of a mix of heavy fuel oil and lighter distillate cuts. 3.1 SHELL ULSFO, 13 C When poured onto the water surface in the meso-scale flume, approximately 5 vol. % of SHELL ULSFO stuck to the flume walls immediately, and much more oil was stuck to the walls throughout the experiment. After 72 hours, 30 vol. % of the applied oil was estimated to be stuck to the flume walls. The oil that did not stick to the flume walls formed uneven lumps on the surface, but these lumps were smoothed with time and formed a continuous slick after 4 hours in the flume. SHELL ULSFO has a pour point of 24 C, and the formations of lumps are a result of semi-solidification of the oil, followed by increased fluidity as a result of the kinetic energy from the waves in the flume. The colour of SHELL ULSFO was initially very dark brown, almost black, but the forming emulsion turned a greenish brown colour during the first 6 hours in the flume. Figure 3-1 shows the difference between SHELL ULSFO immediately after application to the flume water and after 2 hours in the flume. The oil appeared to become more fluid in the first 2 hours, and this was thought to be caused by emulsification and decreased viscosity. However, the measured emulsion viscosities, presented in Table 3-1, showed increasing viscosity throughout the test period, initiating at 5522 mpa s, and reaching mpa s after 72 hours. Large droplets of oil/emulsion was observed in the sampled water, and the number of droplets in the water increased over time. Some larger lumps of emulsion was also mixed into the water but resurfaced rapidly afterwards. After 24 hours in the flume the emulsion had turned dark brown and become more viscous, and this trend continued for the following 48 hours. Figure 3-2 shows the emulsion slick after 6 and 24 hours in the flume. After 72 hours the emulsion lay as thick patches on the surface and was no longer a continuous slick, as seen in Figure 3-3. The water content of the emulsion was high, reaching 81 vol. % after 24 hours of testing, and 83 vol. % prior to dispersion. The water in the flume was slightly discoloured but transparent and cooling systems in the bottom of the flume was visible from above prior to dispersion. This is shown in Figure 3-3, which also shows the difference between the emulsion prior to dispersion and after the 2 nd application of chemical dispersant. Figure 3-1: Immediate solidification (left, 0 hr) and early emulsification (left, 2 hr) Chemical dispersant (Dasic NS) was applied to the emulsion after 72 hours and appeared to have some effect. The water became opaque, and gave an impression of some effectiveness of the dispersant. The emulsion was broken from patches to smaller lumps, and some larger oil/emulsion droplets were seen in the obtained water sample. With repeated dispersion, these same trends increased, and smaller lumps of more homogenous size were formed. Somewhat higher oil content in the water samples were also observed. The emulsion viscosity was affected by the dispersion and was reduced, more drastically after the second application of dispersant than after the first. The water content of the remaining emulsion remained similar as prior to the dispersion, ending at 78 vol. % two hours after the third and final dispersion. Dasic NS was applied a total of three times giving a total DOR of 1:11 and DER = 1:65. Further details regarding DOR and DER are given in Table 3-1. In general, the emulsion of SHELL ULSFO lay low in the water due to high density, and some dispersant will likely have been washed into the water instead of soaking into the oil. This will be relevant in a spill situation Page 140 of 306


 and after the second dispersion (right, 72 hr + 2 disp.")
141 since the presence of continuous waves likely will enhance the washing of the dispersant from the emulsion surface, hence reducing the effect of application of chemical dispersant. Prior to dispersion, a total emulsion volume of 30 L was estimated to remain on the surface based on the observed thickness and surface of the emulsion. After three rounds of dispersion, approximately 20 L of emulsion was collected from the surface and 1.4 L of oil/emulsion was removed from the flume walls. Figure 3-2: Slick formation with greenish hue (left, 6 hr) and slick after 24 hours (left) Figure 3-3: Emulsion prior to dispersion (left, 72 hr) and after the second dispersion (right, 72 hr + 2 disp.) The mass balance shown in Figure 3-4 reflect the low level of dispersion and tendency for adsorption to the flume walls. After 72 hours approximately 50 vol. % of applied oil was assumed available for dispersion. The Page 141 of 306


142 effectiveness of chemical dispersion was low, and little oil was mixed into the water phase, as shown in Figure hours after the third application of chemical dispersant, less than 20 % of the oil available for dispersion had been dispersed. High viscosity, high density and a high pour point likely contribute to the low effectiveness. High viscosity and solidification, as a result of high pour point, can prevent chemical dispersants from soaking into the emulsion. The high density increases the chance for the chemical dispersant to be washed off the emulsion surface. Figure 3-4: Mass balanc of SHELL ULSFO at 13 C Figure 3-5: Effectiveness of application of chemical dispersion on SHELL ULSFO in the meso-scale flume at 13 C Page 142 of 306
143 Table 3-1: results from the meso-scale weathering experiment of SHELL ULSFO at 13 C Sample no. Time Water content Evaporative loss Viscosity Oil in water (hours) (vol. %) (wt. %) (mpa s), 10 s -1 ppm* st application of dispersant: 108 g Dasic NS (DOR =1:42, DER =1:248) 3 min. after disp min. after disp min. after disp nd application of dispersant: 99 g Dasic NS (DOR =1:46, DER =1:271) Total of 1 st and 2 nd application: 207 g Dasic ND (DOR = 1:22, DER = 1:130) 3 min. after disp min. after disp min. after disp rd application of dispersant: 206 g Dasic NS (DOR =1:22, DER =1:130) 3 min. after disp min. after disp min. after disp min after disp Total amount of applied chemical dispersant: 413 g Dasic NS (DOR =1:11, DER =1:65) - No measured data * ppm = parts per million Page 143 of 306
144 3.1.1 Meso-scale flume results compared with OWM predictions for SHELL ULSFO at 13 C Comparisons between measured and predicted values for emulsion viscosity, evaporative loss and water uptake are presented in Figure 3-6, Figure 3-7 and Figure 3-8, respectively. The emulsion viscosity show measured values that are in the upper region compared to the predicted emulsion viscosities during the first days of testing. After three days the emulsion viscosity was intermediate the predicted viscosities for 5 m/s and 10 m/s wind speed. The meso-scale flume aims to represent breaking wave conditions, e.g. > 5 m/s wind speeds, and the measured emulsion viscosities correspond well with the predictions. The measured water uptake was similar to the predicted water uptake for 10 and 15 m/s, as seen in Figure 3-8, and are high similarly to the emulsion viscosity. The measured evaporative loss of SHELL ULSFO was similar to the predictions for 5 and 2 m/s, but are still considered to correspond well with the predicted evaporative loss. Figure 3-6: Emulsion viscosity of SHELL ULSFO at summer temperatures, as measured and predicted Page 144 of 306
145 Figure 3-7: Measured and predicted evaporative loss of SHELL ULSFO at summer temperatures Figure 3-8: Predicted and measured water uptake for SHELL ULSFO at summer temperatures Page 145 of 306


146 3.2 SHELL ULSFO, 2 C SHELL ULSFO solidified immediately when applied to the water surface and formed lumps with an uneven surface, and stuck easily to the flume walls. The surface of the lumps was slowly smoothed, and after 6 hours a thin layer of emulsion had been formed on the surface of the lumps. Pictures taken after application of oil and of the lumps and emulsion after 6 hours are shown in Figure 3-9. The emulsification continued during the testing and functioned as an adhesive between the remaining waxy lumps. This caused the waxy lumps to stick together in clusters in the areas of the flume that were furthest away from the waves. Some of these clusters of waxy lumps were broken apart into separate lumps by the wave energy, while others stuck to the flume wall. After 12 hours all lumps had formed a small layer of emulsion that surrounded them. After 6 hours in the flume, the emulsion viscosity appeared to have dropped compared to the previous sampling after 4 hours. The measured emulsion viscosity support this observation, as a decrease in emulsion viscosity was measured for the first 2 hours, after which an increase was measured after 4 hours, followed by further decrease. After 24 hours an increase in viscosity was again observed, and approximately 50 vol. % of the oil was stuck to the flume walls. It is possible that the emulsion sample taken after 4 hours contained a small wax lump, providing an artificially high viscosity. The emulsification and adsorption to the flume walls continued slowly during the 72 hours of testing but waxy lumps remained on the surface. The mixing of water into the emulsion went slowly, only 10 vol. % water had been mixed in after 12 hours, increasing to 34 vol. % after 24 hours and 55 vol. % after 48 hours. The emulsion consisted of 59 vol. % water after 72 hours, prior to dispersion. Figure 3-9: Immediate solidification (left, 0 hr) and formation of emulsion surrounding waxy lumps (6 hr) After 72 hours both emulsion and waxy lumps remained on the flume water surface, but less than 20 % of the original volume of oil applied to the flume surface was available for dispersion. This was due to a very high degree of adsorption of oil/emulsion to the flume walls (approx. 60 vol. %), and volume loss through sampling of emulsion and some evaporation. Figure 3-10 show the lumps with emulsion after 72 hours, both prior to dispersion (left) and after the 2 nd application of dispersant. With application of chemical dispersant, the emulsion was seen to disperse gradually, creating both a cloud of oil in the water phase as well as mixing down bigger pieces of emulsion that later resurfaced. The chemical dispersant (Dasic NS) appeared very effective on the emulsion, but did not affect the waxy lumps. The chemical dispersant was applied twice, and after the second application only wax lumps remained on the water surface as all emulsion appeared dispersed. The effectiveness of chemical dispersion is thus divided: the emulsion that had formed dispersed well but the waxy lumps remained unaffected. This duality is not presented in Figure 3-12, which include the waxy oil lumps in the category of available oil. The effectiveness on emulsion and waxy lumps combined was less than 40 %. The cumulative DOR and DER of the two applications of chemical dispersant was 1:11 and 1:27, respectively. Details regarding the individual dosages are given in Table 3-2. Page 146 of 306
 The mass balance of SHELL ULSFO at 2 C is shown in Figure 3-11, and reflect the large amount of oil that was adsorbed to the flume walls.")

147 Figure 3-10: Emulsion and waxy lumps prior to dispersion (left, 72 hr) and waxy lumps after the second dispersion (right, 72 hr + 2 disp.) The mass balance of SHELL ULSFO at 2 C is shown in Figure 3-11, and reflect the large amount of oil that was adsorbed to the flume walls. Some evaporation was also measured based on density of water-free oil between 12 hours and 72 hours. The effectiveness of dispersion is shown in Figure 3-12 and show a slight increase in effectiveness with repeated dispersion. Less than 40 % of the available oil was dispersed. Figure 3-11: Mass balance of SHELL ULSFO at 2 C Page 147 of 306
 (vol. %) (wt. %) (mpa s), 10 s -1 ppm* 1 0,5 0 18347 13.5 2 1 0 0.3 17407-3 2 1 0.6 16088-4 4 2 0.6 18545-5 6 3 0.3 14972-6 12 10 0.")
148 Figure 3-12: Effectiveness of application of chemical dispersant to SHELL ULSFO at 2 C Table 3-2: results from the meso-scale weathering experiment of SHELL ULSFO at 2 C Sample no. Time Water content Evaporative loss Viscosity Oil in water (hours) (vol. %) (wt. %) (mpa s), 10 s -1 ppm* 1 0, st application of dispersant: 58 g Dasic NS (DOR = 1:23, DER = 1:56) 3 min. after disp min. after disp min. after disp nd application of dispersant: 60 g Dasic NS (DOR = 1:22, DER = 1:54) 3 min. after disp min. after disp min. after disp min. after disp Total amount of applied chemical dispersant: 118 g Dasic NS (DOR = 1:11, DER = 1:27) - No measured data * ppm = parts per million Page 148 of 306
.")
149 3.2.1 Meso-scale flume results compared with OWM predictions for SHELL ULSFO at 2 C Measured results from the meso-scale flume for emulsion viscosity, evaporative loss and water content are shown in Figure 3-13, Figure 3-14 and Figure 3-15, respectively, in comparison with predictions from the Oil Weathering Model (OWM). The measured emulsion viscosities were initially higher than the prediction, but decreased during the first day (and with initial increasing water content) and remained lower than the predicted viscosities. A slight increase in emulsion viscosity was measured after 48 and 72 hours, compared to the 24 hour measurement. A similar behaviour of decreasing emulsion viscosity with increasing water content was observed for some fractions and emulsions in the bench-scale analyses performed at 13 C. In the 2 C benchscale analyses, a slight increase in emulsion viscosity was observed for the fresh SHELL ULSFO, while the weathered residue showed a reduction in emulsion viscosity despite solidification on the water surface and negligible water uptake. The flume testing show that an emulsion forms with time despite the initial solidification of the oil. The predicted water uptake was slightly more rapid than the measured water uptake in the meso-scale flume. The water content of the emulsion had not shown clear signs of stabilising after 72 hours in the meso-scale flume, and results from the 13 C flume test may indicate that SHELL ULSFO would be able to incorporate a larger volume of water than the predictions show. A further water uptake may have resulted in higher emulsion viscosities. The measured evaporative loss of SHELL ULSFO at 2 C was lower than the predictions for the first 6 hours, but similar to the predictions after 24, 48 and 72 hours. Figure 3-13: Predicted emulsion viscosity compared with measured emulsion viscosities of SHELL ULSFO Page 149 of 306
150 Figure 3-14: Evaporative loss of SHELL ULSFO at winter temperatures, measured results compared to predictions from OWM Figure 3-15: measured water content over time compared to predicted water uptake for SHELL ULSFO at winter temperatures Page 150 of 306
151 3.3 SHELL ULSFO at different temperatures The properties of SHELL ULSFO varied between the test temperatures. Due to the high pour point of the oil, the oil solidified immediately upon application to the water at both test temperatures. However, at 13 C the emulsification and energy from the waves increased the fluidity of the oil which resulted in the formation of a continuous, more or less homogeneous, emulsified slick after some time. At 2 C the waxy lumps that formed upon application of oil remained throughout the test period, with emulsification only occurring on the lumps' surface. The emulsions that formed were also different. At 13 C the emulsion viscosities increased during the experiment whereas at 2 C an initial decrease in emulsion viscosity was observed. After 72 hours the emulsion viscosity was lower at 2 C compared to the emulsion viscosities at 13 C. A possible explanation is that the emulsion that formed at 2 C had a lower content of wax, due to the formation of a stable wax lattice in the lumps. The effectiveness of chemical dispersant was also different between the test temperatures, likely due to the variance in emulsion viscosity. The emulsion dispersed well at 2 C but not at 13 C. Dispersibility limits have been set for SHELL ULSFO through a dispersibility study performed at 13 C. This study indicated that emulsions with viscosities below 4000 mpa s would disperse easily, while emulsions with viscosities between 4000 and 9000 mpa s would show reduced dispersibility, and emulsion viscosities above 9000 mpa s would not be dispersible. Compared to these results, thee poor dispersibility in the 13 C flume experiment is not surprising since the emulsion viscosity was over mpa s when chemical dispersant was applied. Even though the emulsion viscosity was reduced, it remained well above the 9000 mpa s limit. In the 2 C flume test, the emulsion viscosity was only prior to dispersion, lower than the emulsion viscosity at 13 C, and much closer to the set dispersibility limit. At 2 C, waxy lumps will remain on sea surface even though the emulsion may be successfully dispersed. These waxy lumps will require mechanical recovery for removal from the sea surface. SHELL ULSFO emulsions are considered poorly dispersible based on the results from the 13 C flume test, and chemical dispersion is only recommended in early stages of weathering when emulsion viscosities are below the set dispersibility limit (9000 mpa s). The emulsion viscosities of SHELL ULSFO were well above the viscosity limit for expected boom leakage (1000 mpa s). The high emulsion viscosities (> mpa s) may cause reduced recovery rate when using weir skimmers, and the choice of skimmer should be made with this in mind. At both test temperatures, the oil and emulsion stuck to the flume walls (approx. 30 vol. % at 13 C and 60 vol. % at 2 C), effectively removing large volumes of oil from the mass balance for the two tests. This made the estimation of available oil/emulsion for dispersion challenging. The estimates were done based on measurement of slick size as well as slick thickness. Conclusions: The behaviour of SHELL ULSFO is temperature dependent and solidification is a major challenge for this oil due to its high pour point. SHELL ULSFO rapidly form emulsion viscosities that are above the lower limit for dispersibility (3000 mpa s), found in the bench-scale dispersibility study. o A cumulative DOR of 1:11 was applied in both tests over repeated applications: 3 applications of Dasic NS at 13 C 2 applications of Dasic NS at 2 C o The effectiveness of chemical dispersants was low in both flume experiments but higher at 2 C than at 13 C SHELL ULSFO is generally considered to have a low potential for use of chemical dispersants, especially in winter conditions, due to its high pour point (24 C). Page 151 of 306
152 4 Evaluation of SHELL ULSFO and HDME 50 Both HDME 50 and SHELL ULSFO behaved differently at the two test temperatures and shared some similarities in their behaviour. Both oils solidified at 2 C and formed waxy lumps that remained throughout the test period, but also formed emulsions at this temperature. The emulsions that formed at 2 C were observed to disperse, and showed somewhat better effectiveness compared to the emulsions that formed at 13 C. However, the waxy lumps were not dispersed. The emulsion viscosities were seen to decrease for both oils at 2 C at some point during the tests, and for both oils the emulsion viscosities were lower at 2 C prior to dispersion, compared to the 13 C tests. This may explain the higher effectiveness of dispersion seen for both oils, and may also imply a longer window of opportunity for the use of chemical dispersants in cold temperatures, compared to warmer temperatures. At 13 C, both HDME 50 and SHELL ULSFO produced more homogenous emulsions that increased in viscosity with time. In general, dispersion is considered to have a low potential for these two oils. At warmer temperatures when more homogenous emulsions form, the effectiveness of dispersant is low. At lower temperatures, waxy lumps will remain on the sea surface after dispersion. Page 152 of 306
153 SINTEF Ocean AS Postadresse: Postboks 4762 Torgarden 7465 Trondheim Switchboard: Foretaksregister: NO MVA Project memo Ignitability study Marine diesel fuel oils and hybrid fuel oils DATE AUTHOR(S) Kaja Cecilie Hellstrøm Marius Johnsen Frode Leirvik CLIENT(S) Kystverket (Norwegian Coastal Administation) CLASSIFICATION Unrestricted CLIENTS REF. Silje Berger NO. OF PAGES AND APPENDICES: 43 with appendices ABSTRACT The ignitability of six marine fuel oils, MGO, GO, Rotterdam diesel, WRG, HDME 50 and Shell ULSFO has been investigated in a small-scale lab test and in an up-scalled burning test. The results from the performed tests are presented in this memo, along with the predicted time windows for ignitability provided by SINTEF Oil Spill Model (OWM). PREPARED BY Kaja Cecilie Hellstrøm APPROVED BY Mimmi Throne-Holst Issued as part of report OC2017 A-123 Page 153 of 306
154 Table of contents 1 Background and aim of study SINTEF Burning cell Methodology for ignitability Results from Burning cell Up-scaled testing Methodology for up-scaled testing Results from up-scaled testing OWM Scenario for predictions Discussion Experimental results compared to predictions MGO GO WRG Rotterdam Diesel ULSFO HDME Conclusions References APPENDICES A Predictions with OWM Page 154 of 306
155 1 Background and aim of study The ignitability of the diesel oils MGO (500 ppm S), GO 10 ppm S and the Rotterdam Diesel, as well as the wide range gas oil WRG and the two hybrid fuel oils ExxonMobil HDME 50 and SHELL ULSFO were tested using the Burning cell developed by SINTEF (Brandvik et al., 2010a). Samples of the oils with increasing degree of weathering were attempted ignited until this failed. The aim of the test is to give an indication of the potential ignitability of the oils in question relative to the weathering degree. Information regarding the ignitability of an oil is of importance when assessing the possibility for use of insitu burning (ISB) as a response to an oil spill. Such response operations can be of particular interest in remote areas where equipment for other response methods will be stored far away, and demand a long time before arrival. The Arctic is one such area, where the presence of ice may pose a challenge to the use of chemical dispersants or mechanical recovery, in addition to the long response time for necessary equipment. Cold conditions and a cover of ice may prolong the timeframe for ISB since the cold prevent extensive evaporation and the ice prevents spreading of the oil and stop waves from reaching the spill. When wave energy is reduced, the oil is less likely to emulsify which again in general prolong the time window for use of ISB. The aim of this activity was to test the ignitability of the diesel, wide range and residual oils studied during the Diesel Fase II and Hybridolje Fase II projects, and compare the results to ignitability as predicted by the OWM. In addition to the testing in the SINTEF Burning cell, ignitability testing was performed on an up-scaled level in order to improve the interpretation of the results from the Burning cell. The prediction for ignitability provided by the present version of OWM are based on historical data obtained solely from testing with crude oil (Brandvik et al., 2010b). 2 SINTEF Burning cell 2.1 Methodology for ignitability SINTEF has previously conducted several field trials with the aim to study ISB of crude oil in ice. Field experiments have been conducted both at Svea on Svalbard and in the Barents Sea (Stand-Rasmussen et al., 2010; Stand-Rasmussen and Brandvik, 2011). As a part of these experiments a bench-scale Burning cell was developed in order to evaluate the ignitability of oil samples of various degrees of weathering before the remaining oil slick was attempted ignited. The ignitability of oil tested with the Burning cell has previously been verified through field trials with crude oil (Brandvik et al., 2010a). The Burning cell consists of a cup, a cooling apparatus, several thermo-elements for the measuring of oil, water and flame temperatures, and has an inbuilt ventilation. The cup is filled with sea water where upon an oil sample (approx. 150 ml) is added, resulting in a film thickness of 10 ± 2 mm. A sketch of the Burning cell is given in Figure 2-1 below. For the ignition of the selected oils and residues, a propane flame held at 30 angle from the surface was used. The ignition was attempted for 10 seconds at the time, with a pause of 2 minutes in between attempts. Three attempts were made with this ignition. If the oil did not ignite during these three attempts, a final attempt was made with a prolonged ignition time of 40 seconds. The time it took before the oil ignited was documented. The methodology used for the Burning cell was originally designed for the ignition of crude oils where the presence of light components contribute to lower flashpoints than the flash points usually seen for the diesel and oil types used in this project. Since diesel oils often lack the lightest components found in crude oil, a fourth attempt with prolonged ignition time was performed in order to achieve high enough temperature for ignition to occur. The burning efficiency was estimated gravimetrically by comparing the weight of the oil before and after burning. Page 155 of 306

.")
156 Figure 2-1: Sketch of the SINTEF Burning cell, including fan, filter and smoke hood to the left, with details of the safety shield that surrounds the burning cell in the middle and a picture demonstrating the burning cell in action to the right. 2.2 Results from Burning cell The results from the Burning cell are summarized in Table 2-1. A total of nine tests, including five unweathered oils, three water-free 250 C+ residues and one emulsion, were performed in the SINTEF Burning cell. Of each of the five oils, the fresh oil was tested initially, followed by the 250 C+ weathered residue (where this was available). If the weathered residue ignited and the oil had been seen to have emulsifying properties, supplementary testing were performed on emulsions of low degree of weathering. Of the tested oils, this only applied for ULSFO, for which an emulsion of fresh oil and 10 vol. % water was attempted ignited. In Table 2-1 the oils and fractions (+ emulsion) is colour coded according to their ignitability following this scale: Oils that ignited during the first three short ignition attempts were deemed ignitable and are coded with a green colour Oils that ignited during a prolonged ignition time were deemed potentially ignitable and were coded with a yellow colour Oils that did not ignite despite prolonged ignition time were deemed not ignitable and were coded with a red colour The fresh MGO Diesel ignited on the second trial, while its weathered residue ignited only when prolonged ignition time was applied. For the GO Diesel, both the fresh oil and the weathered residue required prolonged ignition time, similar to the fresh Rotterdam diesel. The WRG oil did not ignite even with the prolonged ignition time, and was deemed not ignitable based on the criteria for the Burning cell. HDME 50 was not tested in the Burning cell due to the results for the WRG, which had a lower flash point than HDME 50. Also, gas Page 156 of 306
157 chromatographic analysis reveal that HDME 50 consist of a heavier cut than WRG, and was thus assumed not to ignite in the Burning cell. The ULSFO oil was tested with both fresh fraction, emulsion of fresh fraction (10 vol % water) and the waterfree 250 C+ residue. The fresh ULSFO oil ignited at first trial, while the emulsion and weathered fraction required prolonged ignition time before it ignited. In general, the results from the Burning cell corresponded well with the measured flash points of the oils and their residues. The Burning Efficiency was calculated gravimetrically based on the amount of oil added to the Burning cell cup, and the weight of oil collected after the burning test was over. The samples were allowed to burn until they extinguished by themselves. The Burning Efficiency (BE %) provide relative values of effectiveness since the scale of the fire influences the burning efficiency (Fritt-Rasmussen et al., 2010). Of the oils tested in the burning cell, fresh GO showed the highest Burning efficiency (84 %), while fresh ULSFO expressed the lowest Burning efficiency (48 %). In general, the diesel oils showed high efficiency, above 70 % for both fresh oil and weathered 250 C+ residue. Page 157 of 306
158 Table 2-1: Summarized results from the SINTEF Burning cell. The tests have been colour coded according to the results; Oils that ignited within the first three standard ignition attempts are marked with green, oils, emulsions or residues that ignited with prolonged ignition time is marked in orange, and oils that did not ignite even with prolonged ignition time are marked with red. Name MGO Fresh MGO 250 C+ GO Fresh GO 250 C+ WRG Fresh ULSFO Fresh ULSFO Fresh, 10 % water ULSFO 250 C+ Rotterdam Diesel Fresh Flash point Water temperature ( C) Water flow (ml/min) Oil applied (g) Oil after burning (g) Ignitibility A B C D 1 Prolonged ignition time (sec.) Burning time (min.) Burning efficiency (BE%) 62,5 10, x , x ,5 10, x ,5 10, x ,5 10, , x , x , x ,5 10, x A 4 th attempt at ignition with prolonged ignition time was performed if the oil did not ignite during the first three attempts. 2 The emulsion expanded during heating and spilled over the burning cup. Collecting remnants for gravimetric calculation of burning efficiency was not possible. 3 The residue ignited and went out between attempts B, C and D. 4 This experiment was aborted due to development of smoke and the flame was extinguished deliberately. The burning efficiency was not calculated. Page 158 of 306
159 3 Up-scaled testing 3.1 Methodology for up-scaled testing The results from the bench-scale Burning cell indicated that ISB could be a potential response operation if ignition times were sufficient. In order to investigate this further, an up-scaled testing was conducted at Falck Nutec in Trondheim. Falck Nutec is the largest supplier of quality research-based safety and emergency services to the maritime industry in Norway. They have specialized facilities for experiments and training with fires, and have all required release permits. The tests were performed in a square basin (approximately 60 x 60 cm) filled with fresh water. Approximately 5 L of oil were used in each test, providing a film thickness of 1.4 cm. Special thermometers were used to log the oil temperature, the flame temperature and potential temperature variations in the water column caused by heating from the fire. For ignition, packs containing 500 ml gasoline gel were used. These packs were made by mixing a gelling agent (Sure Fire gel) and generic gasoline to form a relatively solid block. The solidity of the product is dependent on the ratio of gelling agent and gasoline. One gel pack was placed in the middle of the oil film and ignited. If the oil had not ignited by the near end of the packs' burning time (typically 8-10 minutes), another pack was placed in the same spot and ignited. This was repeated twice, giving a total of 3 packs of gelled gasoline per test (if required). Ignition of the oil was manually registered, and determined by the spreading of flames across the oil slick. The time before the first pack of gel was ignited to the oil caught fire was registered, and the number of gel packs required was counted. The burning time of the oil was also documented, and the burning efficiency was determined gravimetrically by comparing the collected remnants after burning relative to the originally applied amount of oil. 3.2 Results from up-scaled testing The results from the up-scaled testing are summarised in Table 3-1. Three DMA type oils, the MGO, GO and Rotterdam diesel oils were tested, in addition to the Wide Range Gas oil (WRG), and the hybrid oils ULSFO and HDME 50, giving a total of six oils of different qualities. Only fresh oils were used for the up-scaled testing, and the order of testing was based on the level of light component present in the oils. The oils with higher content of light components were tested first. All the tested oils ignited but the ignition time varied relative to their chemical composition. The MGO had the lowest flashpoint and was the first oil to be tested but had a longer ignition time than ULSFO despite ULSFO having a higher flash point. Both MGO and ULSFO were ignited with the use of only one pack of gasoline gel. The GO diesel had a flash point intermediate of MGO and ULSFO but required a longer ignition time than these oils and two packs of gasoline gel. The Rotterdam diesel also required the use of two gel packs but had a slightly shorter ignition time than the GO. The WRG and HDME 50 had the highest flash points of the tested oils, and 186 C, respectively. Despite the large difference in flash point, the HDME 50 had a shorter ignition time than the WRG, though both oils had considerably longer ignition times (18 and 19 min, respectively) than the previously tested oils. It must be noted that the ignition time may be influenced by factors such as wind and position of gasoline gel in the basin. The burning efficiency ranged from 34 % for the HDME 50 to 91 % for the Rotterdam Diesel, and the burning time ranged from 7 minutes and 40 seconds for the WRG oil to 17 minutes for the GO diesel. The burning of the Rotterdam diesel produced a black smoke with an odour associated with burning of PAHs. This black smoke was also observed during testing in the Burning cell, which had resulted in an abortion of this test in the bench scaled testing. The Burning efficiencies from the Burning cell and the up-scaled testing at Nutec are presented in a bar chart in Figure 3-1. Due to the forced stop of the burning test with Rotterdam Diesel in the Burning cell, burning efficiency for this oil is only available for the up-scaled testing. WRG did not ignite in the Burning cell testing, while HDME 50 was not been tested since its flash point was deemed too high for successful ignition in the Page 159 of 306
160 bench-scale test. The comparison of Burning efficiencies of MGO, ULSFO and GO show that the relative efficiency had a similar pattern in the up-scaled testing compared to the Burning cell results. However, there were smaller relative differences in the up-scaled testing compared to the Burning cell testing. Rotterdam Diesel was seen to have the highest Burning Efficiency in the up-scaled testing (91 %), while HDME 50 had the lowest efficiency (34 %). Table 3-1: Results from the up-scaled ignitability testing Name Flash point ( C) Oil applied (g) Oil after burning (g) Ignitibility (No. of gel bags required) Ignition time (min:sec) Burning time (min.) Burning efficiency (BE %) Order of testing MGO x 03:30 16: ULSFO x 00:45 11: GO x 12:40 17: Rotterdam x 10:40 10: WRG x 19:20 7: HDME x 18:20 10: Comparison of burning efficiency (%) Burning Cell Up-scaled testing MGO ULSFO GO Rotterdam Diesel WRG HDME 50 Figure 3-1: Burning efficiency from the two performed tests: SINTEF Burning cell and up-scaled testing at Nutec. Results from testing with fresh oil are used for the comparison. 4 OWM A module for the prediction of ignitability of an oil is available in the Oil Weathering Model. This module was based on results from previously performed field experiments, and the development of the algorithm is described in Brandvik et al., 2010b. This algorithm is based solely on results from crude oils of varying properties, and no diesel oils or refined fuels were included in the data basis for the algorithm. All the crude oils used in the algorithms data basis had emulsifying properties, and this property strongly influence the predictions of ignitability. In general, the algorithm assume that formation of (stable) emulsions reduce the ignitability of the oil significantly. The DMA diesel oils tested in the present project had poor or no emulsifying Page 160 of 306
161 properties, and thus lie outside the scope for the ignitability model. The hybrid fuel oils, though having emulsifying properties, also lie outside the scope for the model. For this reason, the OWM may predict that diesel oils will remain ignitable for a longer time than realistic, and all predictions should be viewed in relation to other properties. The ignitability algorithm uses the following parameters for the predictions: Water content Viscosity Content of wax and asphaltenes Flash point of oil Since the lighter fraction has been removed from diesel oils, these products have a higher flash point than common for fresh crude oils. This will demand a higher oil temperature for these oils for successful ignition, which may require a longer ignition time, compared to crude oils. This was seen in the test with the Burning cell, where a prolonged ignition time was necessary for the ignition of fresh diesel, whereas fresh crude oil, and maybe even some water free residues of crude oils, would be expected to ignite easily within the first three trials. Oils from heavier distillate cuts, such as the WRG and the HDME 50, as well as residual fuel oils like ULSFO, often have a significant content of wax and potentially asphaltenes. The presence of these compounds gave these oils different emulsifying properties compared to diesel oils, and this will affect the time window for ignitibility predicted by OWM. Predicted results for these oils tested should be viewed as tentative results, and handled with the necessary care and caution. 4.1 Scenario for predictions Despite its limitations in predicting ignitability of diesel oils and other fuel oils, the OWM has been attempted used to predict the ignitability of both diesel oils and hybrid fuel oil types. The chosen scenario for the predictions is designed to represent a situation where spilled oil is trapped or contained immediately to a film thickness of 5 mm. The trapping could be against ice floes, shoreline, booms or in a secluded bay. It has been assumed that natural dispersion has been prevented, and that the oil film thickness remain thick throughout the predicted time line. Two temperatures were used for the scenario, 0 C and 13 C, representing conditions found in the Arctic and in Norwegian waters. No ice cover was selected for the predictions. General experience from attempted, operational ignition of oil spills is that at high wind speeds it would be very difficult to ignite an oil slick, and for this reason only calm weather conditions, represented by 2 and 5 m/s, have been included in the scenario. The time line for the predictions were set at 5 days. The used parameters are summarised in Table 4-1, the results from the predictions are summarised in Table 4-2, and the predictions from OWM are given in Appendix 1. Table 4-1: Parameters used in predictions from OWM Parameter MGO GO WRG HDME 50 ULSFO Film thickness (mm) Temperature ( C) 0/13 0/13 0/13 0/13 0/13 Wind speeds (m/s) 2/5 2/5 2/5 2/5 2/5 Time line (days) Page 161 of 306
162 Table 4-2: Ignitability as predicted by OWM for the set parameters and for all tested oils Oil Predicted ignitability 13 C 0 C 2 m/s 5 m/s 2 m/s 5 m/s MGO > 5 days > 5 days > 5 days > 5 days GO > 5 days > 5 days > 5 days > 5 days WRG < 12 hours < 3 hours < 2 hours < 0.5 hours Rotterdam Diesel > 5 days < 5 days > 5 days > 5 days HDME 50 < 2 hours < 0.5 hour > 5 days < 2 days ULSFO < 1 day < 6 hours < 2 days < 9 hours Page 162 of 306
163 5 Discussion 5.1 Experimental results compared to predictions The results from the Burning cell and up-scaled testing are summarised shortly for each of the tested oils, and have been compared to the results of the predictions. Predictions for evaporative loss and flash point for the same oils and parameters have also been used for this discussion MGO Fresh MGO ignited in the Burning cell on the second attempt, and required only one bag of gelled gasoline to ignite in the larger scale testing at Nutec, and the fresh oil can be considered ignitable. When tested in the Burning cell, the weathered 250 C+ residue of MGO ignited only with prolonged burning time, demonstrating that weathering will reduce the ignitability of this oil. The residue of MGO was not tested at Nutec due to lack of required volume. The predicted ignitability indicate that MGO will be ignitable after 5 days under the set parameters, which does not reflect the reduced ignitability observed for the weathered residue in the Burning cell. However, the predicted evaporative loss is low after 5 days of weathering with the set film thickness of 5 mm, and the predicted flash points are still less than 100 C after 5 days for MGO in the given scenario (see appendix A.1). These flash points are below those of the 250 C+ residue, and would likely be low enough for successful ignition. The predictions did not show any difference in ignitability between 0 and 13 C GO Neither fresh GO nor its 250 C+ residue ignited under the standard conditions in the Burning cell. Prolonged ignition time was required for successful ignition of both the fresh oil and the residue. GO has less of the lightest components compared to MGO, and this is reflected in its flash points. The lack of these lightest components may explain why GO did not ignite as easily as MGO in the Burning cell. In the up-scaled testing at Nutec, 2 bags of gasoline was required before the oil ignited, and these results corresponded well with the observations from the Burning cell. The predicted ignitability of GO was similar to MGO, and the diesel was predicted to remain ignitable for more than 5 days under the set parameters. Similarly to MGO, GO is predicted to have a low evaporative loss and flash points below 100 C after 5 days (see appendix A.2). Under the set circumstances, ignitability of the oil slick is considered to be possible WRG WRG showed varying weathering behaviour at different temperatures, and the OWM predictions are based on different data set (2 C for 0 C predictions, and 13 C data for 13 C predictions). Fresh WRG did not ignite in the Burning cell even after prolonged ignition time, but did ignite in the up-scaled testing at Nutec, requiring 3 bags of gasoline before ignition. The predicted ignitability of WRG is considerably shorter than the MGO and GO diesels, likely due to the emulsifying properties of WRG (see Appendix A.4). At 13 C, ignition was predicted possible for less than 12 hours under calm wind conditions, while at 0 C ignition was predicted possible for less than 2 hours under similarly calm wind conditions. This variance between temperatures is contrary to what one might expect. Higher temperatures is expected to increase evaporation and thus provide a shorter period of ignitability compared to lower temperatures. The WRG consist of a heavy distillate cut and was not expected to have any significant evaporative loss, regardless of temperature. However, the observe variance between temperatures is likely caused by stronger emulsion stability at lower temperatures, which was observed for WRG, and is reflected in the two different data set the predictions are based on. This demonstrate the weight emulsifying properties have in the module for prediction of ignitability. Based on the results from the Burning cell, WRG would be considered not ignitable, but the oil did ignite in the up-scaled testing. However, the long ignition time observed in the up-scaled testing indicate that the conditions required for ignition may be difficult to reproduce in a real event. Methods of ignition with high temperatures may enable ignition in such cases. The poor ignitability of this oil should be considered if this oil is to be used in remote areas where ISB may be a preferred response operation. Page 163 of 306
164 5.1.4 Rotterdam Diesel Fresh Rotterdam Diesel ignited after prolonged ignition time in the Burning cell and also caught fire after use of 2 bags of gasoline in the up-scaled testing. The prolonged ignition time reflect the flash point of this diesel, which was higher than the flash points of MGO, GO and ULSFO. The predicted ignitability of Rotterdam diesel was similar to those of MGO and GO, and the diesel was predicted to remain ignitable for more than 5 days for all scenarios. Similar to MGO and GO, the predicted evaporative loss was low, and the predicted flash points after 5 days were below 120 C. Ignition may still be possible at this flash point. In both the Burning cell test and the up-scaled testing, Rotterdam diesel created a black smoke associated with the burning of PAHs. This observation correspond well with the analysed chemical composition of this oil (see toxicity memo), which show a high content of PAHs. The need for additional HSE consideration with risk of exposure to the smoke should be evaluated ULSFO Fresh ULSFO ignited easily in both the Burning cell and during the up-scaled testing, requiring only one attempt in the Burning cell and one bag of gasoline in the up-scaled testing. Both a weathered 250 C+ residue of ULSFO and an emulsion made from fresh ULSFO and 10 vol. % water were tested in the Burning cell. The weathered residue ignited initially after the second attempt of ignition, but the flame extinguished rapidly. The same behaviour was observed after the third attempt of ignition, and extended ignition time was required for the residue to continue to burn. The emulsion also ignited after an extended ignition time. Due to the presence of water, the emulsion expanded and spilled over the container and prevented calculation of the burning efficiency. The predicted time window for ignitability of ULSFO was restricted to less than 1 day at 13 C and 2 days at 0 C for 2 m/s. The observations from burning of weathered oil in the Burning cell indicate that weathering of ULSFO will reduce the oils' ignitability rapidly, and thus support the predictions. Neither the predicted evaporative loss nor the predicted flash point show great change, and the oil was predicted to have a flash point of less than 110 C at 13 C after 5 days. Changes in predicted water content due to the oils emulsifying properties (see Appendix A.6) is a likely reason for the limited predicted time window for ignitability HDME 50 HDME 50 was not tested in the Burning cell but was used in the up-scaled testing. Similar to WRG, which also had a very high flash point, HDME 50 required three bags of gelled gasoline before igniting in the upscale testing. Despite having a higher flash point than WRG, HDME 50 had a shorter ignition time in the upscaled testing than WRG. HDME 50 also showed temperature dependent behaviour, and the predictions of HDME 50 are based on two data set, similarly to WRG, one based on weathering data for 2 C and another on 13 C, used for 0 and 13 C predictions, respectively. For HDME 50, emulsification will occur slowly at low temperatures, contrary to the behaviour expected for WRG. With slow emulsification, the window of opportunity for ISB will remain for a longer time. The OWM predictions for ignitability indicate that the oil will remain ignitable for less than 5 days at 0 C and 2 m/s wind, and less than 2 hours at 13 C for the same wind speed. Very little change was predicted in the evaporative loss or the flash point of HDME 50. However, a change in viscosity was predicted due to water uptake (see Appendix A.5). At 13 C, the water uptake was predicted to start immediately after a spill, while at 0 C, the water uptake was predicted to begin only after 2 hours of weathering. After 5 days of weathering, the emulsions were predicted to contain 60 vol. % water at 13 C and approx. 32 vol. % at 0 C (5 m/s wind). The high flash point of this oil will likely complicate ignition of this oil in an acute situation since the temperature of the ignitor will have to be high, and indicate the importance of having an optimal ignition source with a high temperature. Page 164 of 306
165 6 Conclusions The Burning cell testing was performed in order to assess the ignitability of diesel and hybrid oils through use of an already established test methodology. The methodology has previously been developed based on trials with ignition of crude oil, and deviations from the normally set standard limits were expected for the refined oil products tested in this project. Prolonged ignition time was applied since the set standard of three attempts were designed for different degrees of weathered crude oils with potential remnants of light components. The results showed that the tested diesel oils and the hybrid oil ULSFO, with residues, were ignitable under these bench-scale settings. The WRG oil did not ignite with the prolonged ignition time, and the HDME 50 was not tested in the Burning cell. The aim of the up-scaled testing was to reveal if the oils classified as poorly or not ignitable by the results in the Burning cell would ignite under conditions that could not be obtained in the laboratory, and to investigate the requirements for ignitions of the different oil types. The results from the up-scaled testing supported the findings from the Burning cell experiments, since the oils requiring extra ignition time in the Burning cell in general required longer ignition time in the up-scaled testing. The up-scaled testing also showed that even high cut distillates such as WRG and HDME 50 ignite if a heat source of the necessary temperature is available for sufficient time. The OWM has limitations in its module for predicting ignitibility of diesel and residual oils, since only experiments with emulsifying crude oils have formed the data basis for the algorithms. For this reason, the predictions must be considered as tentative and handled with due care and caution. The development of a module that better predict the ignitability of products such as diesel oils and other refined products would require significant testing. The ignitability module in OWM was used for a scenario where released oil is immediately contained, forming and remaining in a 5 mm thick oil film. Wind speeds of 10 m/s or higher were not included as ignition of oil spills under such weather conditions have been found difficult in previous operational attempts. The results from the testing with the Burning cell and up-scaled testing were used for comparison with OWM predictions of ignitability, evaporative loss, flash point and emulsion viscosity, as well as water content for the oils with emulsifying properties. The results indicate that weathered residues of diesel oils may be ignitable for some time, under the right conditions, and that the hybrid oils would have shorter time windows for ignitability. It must be noted that the film thickness was set at 5 mm for all predictions, and that the thickness of the oil film in the Burning cell was approximately 0.75 cm and 1.4 cm in the up-scaled testing. The successful ignition of both diesel oils and hybrid oils in the up-scaled testing show that ISB may be a potential response method for the tested oils. However, both WRG and HDME 50 had very long ignition times (in this testing 19 and 18 min, respectively), and this may limit the practical application of ISB for these oils. Since the bench scale and up-scaled tests performed were designed only to reveal the ignitability of the tested oils (and not represent realistic scenarios), further documentation will be necessary in order to determine the feasibility of ISB of diesel oils and hybrid oils in cold and/or remote regions, such as the Arctic. The results also show the importance of developing ignition sources with sufficiently high ignition temperatures. A higher ignition temperature will likely reduce the ignition time. Page 165 of 306
166 7 References Brandvik, P.J., Fritt-Rasmussen, J., Daniloff, R., og Leirvik, F., 2010a. Using a small scale laboratory Burning cell to measure ignitability for in situ burning of oil spills as a function of weathering. Proceedings of the 33rd AMOP Technical Seminar on Environmental Contamination and Response, Environment, Canada. Brandvik, P.J., Fritt-Rasmussen, J., Reed, M. and Bodsberg, N.R., 2010b. Predicting ignitability for in situ burning of oil spills as a function of oil type and weathering degree. Proceedings of the 33rd AMOP Technical Seminar on Environmental Contamination and Response, Environmental Canada. Fritt-Rasmussen, J., Brandvik, P.J., Villumsen, A., og Stenby, E.H., Comparing ignitability for in-situ burning of oil spills for an asphaltenic, a waxy and a light crude oil as a function of weathering conditions under arctic conditions. Cold Regions Science and Technology, Volume 72, March 2012, p. 1-6 Fritt-Rasmussen, J. og Brandvik, P.J., Measuring ignintability for in situ burning of oil spills weathered under Arctic conditions: From laborarory studies to large-scale field examples. Marine Pollution Bulletin, vol. 62, 2011, p Page 166 of 306
167 A Predictions with OWM The predicted behaviour of the tested oils are presented in this appendix. Included properties are ignitability, evaporative loss, emulsion viscosity, and flash point. The predictions of ignitability is given as either ignitable, seen as a solid (5 m/s) or dashed (2 m/s) line just below 1 in the graph, or not ignitable, seen as one line just above 0 in the graph. When the predictions of the different wind conditions correspond, the lines overlap, and are seen as only one line. The ignitability index does not provide a degree of ignitability, but only true/false predictions, where time windows where the oil is predicted to be ignitable is shown as > 0.5 and when the oil is predicted to not be ignitable is shown as < 0.5. The lines that indicates ignitability can be seen to cross the chart between time posts where the oil is predicted ignitable and not ignitable (e.g. between 1 and 2 hours for WRG, 2 m/s). All charts present the same logarithmic time scale spanning from 15 minutes to 5 days on the x-axis. The values for the y-axis vary with the properties, but have been set at specific values for possible direct comparison of oils of DMA-quality, and between oils with emulsifying properties (WRG, HDME 50, and ULSFO). Some properties are possible to compare regardless of oil type. Page 167 of 306
168 MGO 500 ppm S ( ) Property: IGNITABILITY Oil Type: MGO 500 PPM S Description: Esso Slagen Data Source: SINTEF Applied Chemistry (2015), Weathering data OWModel Surface release - Terminal Oil film thickness: 5 mm Release rate/duration: 1.33 metric tons/minute for 15 minute(s) Pred. date: Apr. 27, 2017 Wind Speed (m/s): 5 Wind Speed (m/s): 2 Not ignitable Ignitable 1 Sea surface temperature: 0 C Ignitability index Hours Days 1 Sea surface temperature: 13 C Ignitability index Hours Days Page 168 of 306
169 Property: EVAPORATIVE LOSS Oil Type: MGO 500 PPM S Description: Esso Slagen Data Source: SINTEF Applied Chemistry (2015), Weathering data OWModel Surface release - Terminal Oil film thickness: 5 mm Release rate/duration: 1.33 metric tons/minute for 15 minute(s) Pred. date: May. 04, 2017 Wind Speed (m/s): 5 Wind Speed (m/s): 2 50 Sea surface temperature: 0 C 40 Evaporated (%) Hours Days 50 Sea surface temperature: 13 C 40 Evaporated (%) Hours Days Page 169 of 306
170 Property: VISCOSITY OF EMULSION Oil Type: MGO 500 PPM S Description: Esso Slagen Data Source: SINTEF Applied Chemistry (2015), Weathering data OWModel Surface release - Terminal Oil film thickness: 5 mm Release rate/duration: 1.33 metric tons/minute for 15 minute(s) Pred. date: Apr. 27, 2017 Wind Speed (m/s): 5 Wind Speed (m/s): Sea surface temperature: 0 C Viscosity (cp) Hours Days 100 Sea surface temperature: 13 C Viscosity (cp) Hours Days Based on viscosity measurements carried out at a shear rate of 10 reciprocal seconds. Page 170 of 306
171 Property: FLASH POINT FOR WATER-FREE OIL Oil Type: MGO 500 PPM S Description: Esso Slagen Data Source: SINTEF Applied Chemistry (2015), Weathering data OWModel Surface release - Terminal Oil film thickness: 5 mm Release rate/duration: 1.33 metric tons/minute for 15 minute(s) Pred. date: May. 04, 2017 Wind Speed (m/s): 5 Wind Speed (m/s): 2 No fire hazard Fire hazard in tankage (<60 C) Fire hazard at sea surface (below sea temperature) 150 Sea surface temperature: 0 C Flash Point ( C) Hours Days 150 Sea surface temperature: 13 C Flash Point ( C) Hours Days Based on flash point measurements of weathered, water-free oil residues. Page 171 of 306
172 GO 10 ppm S ( ) Property: IGNITABILITY Oil Type: GO 10 PPM S - 10 C 2016 Description: Mongstad refinery, received from Kystverket Data Source: SINTEF Applied Chemistry (2015), Weathering data OWModel Surface release - Terminal Oil film thickness: 5 mm Release rate/duration: 1.33 metric tons/minute for 15 minute(s) Pred. date: Apr. 27, 2017 Wind Speed (m/s): 5 Wind Speed (m/s): 2 Not ignitable Ignitable 1 Sea surface temperature: 0 C Ignitability index Hours Days 1 Sea surface temperature: 13 C Ignitability index Hours Days Page 172 of 306
173 Property: EVAPORATIVE LOSS Oil Type: GO 10 PPM S - 10 C 2016 Description: Mongstad refinery, received from Kystverket Data Source: SINTEF Applied Chemistry (2015), Weathering data OWModel Surface release - Terminal Oil film thickness: 5 mm Release rate/duration: 1.33 metric tons/minute for 15 minute(s) Pred. date: May. 04, 2017 Wind Speed (m/s): 5 Wind Speed (m/s): 2 50 Sea surface temperature: 0 C 40 Evaporated (%) Hours Days 50 Sea surface temperature: 13 C 40 Evaporated (%) Hours Days Page 173 of 306
174 Property: FLASH POINT FOR WATER-FREE OIL Oil Type: GO 10 PPM S - 10 C 2016 Description: Mongstad refinery, received from Kystverket Data Source: SINTEF Applied Chemistry (2015), Weathering data OWModel Surface release - Terminal Oil film thickness: 5 mm Release rate/duration: 1.33 metric tons/minute for 15 minute(s) Pred. date: May. 04, 2017 Wind Speed (m/s): 5 Wind Speed (m/s): 2 No fire hazard Fire hazard in tankage (<60 C) Fire hazard at sea surface (below sea temperature) 150 Sea surface temperature: 0 C Flash Point ( C) Hours Days 150 Sea surface temperature: 13 C Flash Point ( C) Hours Days Based on flash point measurements of weathered, water-free oil residues. Page 174 of 306
175 Property: VISCOSITY OF EMULSION Oil Type: GO 10 PPM S - 10 C 2016 Description: Mongstad refinery, received from Kystverket Data Source: SINTEF Applied Chemistry (2015), Weathering data OWModel Surface release - Terminal Oil film thickness: 5 mm Release rate/duration: 1.33 metric tons/minute for 15 minute(s) Pred. date: May. 04, 2017 Wind Speed (m/s): 5 Wind Speed (m/s): Sea surface temperature: 0 C Viscosity (cp) Hours Days 100 Sea surface temperature: 13 C Viscosity (cp) Hours Days Based on viscosity measurements carried out at a shear rate of 10 reciprocal seconds. Page 175 of 306
176 Rotterdam Diesel ( ) Property: IGNITABILITY Oil Type: ROTTERDAM DIESEL 2016 Description: Data Source: SINTEF Materials and Chemistry (2016), Weatherin OWModel Surface release - Terminal Oil film thickness: 5 mm Release rate/duration: 1.33 metric tons/minute for 15 minute(s) Pred. date: Apr. 27, 2017 Wind Speed (m/s): 5 Wind Speed (m/s): 2 Not ignitable Ignitable 1 Sea surface temperature: 0 C Ignitability index Hours Days 1 Sea surface temperature: 13 C Ignitability index Hours Days Page 176 of 306
177 Property: EVAPORATIVE LOSS Oil Type: ROTTERDAM DIESEL 2016 Description: Data Source: SINTEF Materials and Chemistry (2016), Weatherin OWModel Surface release - Terminal Oil film thickness: 5 mm Release rate/duration: 1.33 metric tons/minute for 15 minute(s) Pred. date: Apr. 27, 2017 Wind Speed (m/s): 5 Wind Speed (m/s): 2 50 Sea surface temperature: 0 C 40 Evaporated (%) Hours Days 50 Sea surface temperature: 13 C 40 Evaporated (%) Hours Days Page 177 of 306
178 Property: FLASH POINT FOR WATER-FREE OIL Oil Type: ROTTERDAM DIESEL 2016 Description: Data Source: SINTEF Materials and Chemistry (2016), Weatherin OWModel Surface release - Terminal Oil film thickness: 5 mm Release rate/duration: 1.33 metric tons/minute for 15 minute(s) Pred. date: May. 04, 2017 Wind Speed (m/s): 5 Wind Speed (m/s): 2 No fire hazard Fire hazard in tankage (<60 C) Fire hazard at sea surface (below sea temperature) 150 Sea surface temperature: 0 C Flash Point ( C) Hours Days 150 Sea surface temperature: 13 C Flash Point ( C) Hours Days Based on flash point measurements of weathered, water-free oil residues. Page 178 of 306
179 Property: VISCOSITY OF EMULSION Oil Type: ROTTERDAM DIESEL 2016 Description: Data Source: SINTEF Materials and Chemistry (2016), Weatherin OWModel Surface release - Terminal Oil film thickness: 5 mm Release rate/duration: 1.33 metric tons/minute for 15 minute(s) Pred. date: May. 04, 2017 Wind Speed (m/s): 5 Wind Speed (m/s): Sea surface temperature: 0 C Viscosity (cp) Hours Days 100 Sea surface temperature: 13 C Viscosity (cp) Hours Days Based on viscosity measurements carried out at a shear rate of 10 reciprocal seconds. Page 179 of 306
180 WRG ( ) Property: IGNITABILITY Oil Type: WIDE RANGE GAS OIL 2 C 2016 Description: Mongstad refinery recieved from Kystverket Data Source: SINTEF Applied Chemistry (2015), Weathering data OWModel Surface release - Terminal Oil film thickness: 5 mm Release rate/duration: 1.33 metric tons/minute for 15 minute(s) Pred. date: Apr. 27, 2017 Wind Speed (m/s): 5 Wind Speed (m/s): 2 Not ignitable Ignitable 1 Sea surface temperature: 0 C Ignitability index Hours Days Property: IGNITABILITY Oil Type: WIDE RANGE GAS OIL 10 C 2016 Description: Mongstad refinery recieved from Kystverket Data Source: SINTEF Applied Chemistry (2015), Weathering data used OWModel Surface release - Terminal Oil film thickness: 5 mm Release rate/duration: 1.33 metric tons/minute for 15 minute(s) Pred. date: Apr. 27, 2017 Wind Speed (m/s): 5 Wind Speed (m/s): 2 Not ignitable Ignitable 1 Sea surface temperature: 13 C Ignitability index Hours Days Page 180 of 306
181 Property: EVAPORATIVE LOSS Oil Type: WIDE RANGE GAS OIL 2 C 2016 Description: Mongstad refinery recieved from Kystverket Data Source: SINTEF Applied Chemistry (2015), Weathering data OWModel Surface release - Terminal Oil film thickness: 5 mm Release rate/duration: 1.33 metric tons/minute for 15 minute(s) Pred. date: May. 04, 2017 Wind Speed (m/s): 5 Wind Speed (m/s): 2 50 Sea surface temperature: 0 C 40 Evaporated (%) Hours Days Property: EVAPORATIVE LOSS Oil Type: WIDE RANGE GAS OIL 10 C 2016 Description: Mongstad refinery recieved from Kystverket Data Source: SINTEF Applied Chemistry (2015), Weathering data used OWModel Surface release - Terminal Oil film thickness: 5 mm Release rate/duration: 1.33 metric tons/minute for 15 minute(s) Pred. date: May. 04, 2017 Wind Speed (m/s): 5 Wind Speed (m/s): 2 50 Sea surface temperature: 13 C 40 Evaporated (%) Hours Days Page 181 of 306
182 Property: FLASH POINT FOR WATER-FREE OIL Oil Type: WIDE RANGE GAS OIL 2 C 2016 Description: Mongstad refinery recieved from Kystverket Data Source: SINTEF Applied Chemistry (2015), Weathering dat OWModel Surface release - Terminal Oil film thickness: 5 mm Release rate/duration: 1.33 metric tons/minute for 15 minute(s) Pred. date: May. 04, 2017 Wind Speed (m/s): 5 Wind Speed (m/s): 2 No fire hazard Fire hazard in tankage (<60 C) Fire hazard at sea surface (below sea temperature) 200 Sea surface temperature: 0 C 150 Flash Point ( C) Hours Days Property: FLASH POINT FOR WATER-FREE OIL Oil Type: WIDE RANGE GAS OIL 10 C 2016 Description: Mongstad refinery recieved from Kystverket Data Source: SINTEF Applied Chemistry (2015), Weathering dat OWModel Surface release - Terminal Oil film thickness: 5 mm Release rate/duration: 1.33 metric tons/minute for 15 minute(s) Pred. date: May. 04, 2017 Wind Speed (m/s): 5 Wind Speed (m/s): 2 No fire hazard Fire hazard in tankage (<60 C) Fire hazard at sea surface (below sea temperature) 200 Sea surface temperature: 13 C 150 Flash Point ( C) Hours Days Page 182 of 306
183 Property: VISCOSITY OF EMULSION Oil Type: WIDE RANGE GAS OIL 2 C 2016 Description: Mongstad refinery recieved from Kystverket Data Source: SINTEF Applied Chemistry (2015), Weathering data OWModel Surface release - Terminal Oil film thickness: 5 mm Release rate/duration: 1.33 metric tons/minute for 15 minute(s) Pred. date: May. 04, 2017 Wind Speed (m/s): 5 Wind Speed (m/s): Sea surface temperature: 0 C Viscosity (cp) Hours Days Property: VISCOSITY OF EMULSION Oil Type: WIDE RANGE GAS OIL 10 C 2016 Description: Mongstad refinery recieved from Kystverket Data Source: SINTEF Applied Chemistry (2015), Weathering data used OWModel Surface release - Terminal Oil film thickness: 5 mm Release rate/duration: 1.33 metric tons/minute for 15 minute(s) Pred. date: May. 04, 2017 Wind Speed (m/s): 5 Wind Speed (m/s): Sea surface temperature: 13 C Viscosity (cp) Hours Days Page 183 of 306
184 Property: WATER CONTENT Oil Type: WIDE RANGE GAS OIL 2 C 2016 Description: Mongstad refinery recieved from Kystverket Data Source: SINTEF Applied Chemistry (2015), Weathering data OWModel Surface release - Terminal Oil film thickness: 5 mm Release rate/duration: 1.33 metric tons/minute for 15 minute(s) Pred. date: May. 03, 2017 Wind Speed (m/s): 5 Wind Speed (m/s): Sea surface temperature: 0 C 80 Water content (%) Hours Days Property: WATER CONTENT Oil Type: WIDE RANGE GAS OIL 10 C 2016 Description: Mongstad refinery recieved from Kystverket Data Source: SINTEF Applied Chemistry (2015), Weathering data used OWModel Surface release - Terminal Oil film thickness: 5 mm Release rate/duration: 1.33 metric tons/minute for 15 minute(s) Pred. date: May. 03, 2017 Wind Speed (m/s): 5 Wind Speed (m/s): Sea surface temperature: 13 C 80 Water content (%) Hours Days Page 184 of 306
185 HDME 50 ( ) Property: IGNITABILITY Oil Type: HDME 50, 2 C, 2016 Description: Data Source: SINTEF Materials and Chemistry (2016), Weatherin OWModel Surface release - Terminal Oil film thickness: 5 mm Release rate/duration: 1.33 metric tons/minute for 15 minute(s) Pred. date: May. 04, 2017 Wind Speed (m/s): 5 Wind Speed (m/s): 2 Not ignitable Ignitable 1 Sea surface temperature: 0 C Ignitability index Hours Days Property: IGNITABILITY Oil Type: HDME Description: OWModel Data Source: SINTEF Materials and Chemistry (2016), Weathering data used Surface release - Terminal Oil film thickness: 5 mm Release rate/duration: 1.33 metric tons/minute for 15 minute(s) Pred. date: Apr. 27, 2017 Wind Speed (m/s): 5 Wind Speed (m/s): 2 Not ignitable Ignitable 1 Sea surface temperature: 13 C Ignitability index Hours Days Page 185 of 306
186 Property: EVAPORATIVE LOSS Oil Type: HDME 50, 2 C, 2016 Description: Data Source: SINTEF Materials and Chemistry (2016), Weatherin OWModel Surface release - Terminal Oil film thickness: 5 mm Release rate/duration: 1.33 metric tons/minute for 15 minute(s) Pred. date: May. 04, 2017 Wind Speed (m/s): 5 Wind Speed (m/s): 2 50 Sea surface temperature: 0 C 40 Evaporated (%) Hours Days Property: EVAPORATIVE LOSS Oil Type: HDME Description: OWModel Data Source: SINTEF Materials and Chemistry (2016), Weathering data used Surface release - Terminal Oil film thickness: 5 mm Release rate/duration: 1.33 metric tons/minute for 15 minute(s) Pred. date: May. 03, 2017 Wind Speed (m/s): 5 Wind Speed (m/s): 2 50 Sea surface temperature: 13 C 40 Evaporated (%) Hours Days Page 186 of 306
187 Property: FLASH POINT FOR WATER-FREE OIL Oil Type: HDME 50, 2 C, 2016 Description: Data Source: SINTEF Materials and Chemistry (2016), Weatherin OWModel Surface release - Terminal Oil film thickness: 5 mm Release rate/duration: 1.33 metric tons/minute for 15 minute(s) Pred. date: Apr. 27, 2017 Wind Speed (m/s): 5 Wind Speed (m/s): 2 No fire hazard Fire hazard in tankage (<60 C) Fire hazard at sea surface (below sea temperature) 200 Sea surface temperature: 0 C 150 Flash Point ( C) Hours Days Property: FLASH POINT FOR WATER-FREE OIL Oil Type: HDME Description: OWModel Data Source: SINTEF Materials and Chemistry (2016), Weathering data used Surface release - Terminal Oil film thickness: 5 mm Release rate/duration: 1.33 metric tons/minute for 15 minute(s) Pred. date: Apr. 27, 2017 Wind Speed (m/s): 5 Wind Speed (m/s): 2 No fire hazard Fire hazard in tankage (<60 C) Fire hazard at sea surface (below sea temperature) 200 Sea surface temperature: 13 C 150 Flash Point ( C) Hours Days Page 187 of 306
188 Property: VISCOSITY OF EMULSION Oil Type: HDME 50, 2 C, 2016 Description: Data Source: SINTEF Materials and Chemistry (2016), Weatherin OWModel Surface release - Terminal Oil film thickness: 5 mm Release rate/duration: 1.33 metric tons/minute for 15 minute(s) Pred. date: May. 04, 2017 Wind Speed (m/s): 5 Wind Speed (m/s): 2 Chemically dispersible (<3000 cp) Reduced chemical dispersibility Poorly / slowly chemically dispersible (>10000 cp) Sea surface temperature: 0 C Viscosity (cp) Hours Days Property: VISCOSITY OF EMULSION Oil Type: HDME Description: OWModel Data Source: SINTEF Materials and Chemistry (2016), Weathering data used Surface release - Terminal Oil film thickness: 5 mm Release rate/duration: 1.33 metric tons/minute for 15 minute(s) Pred. date: Apr. 27, 2017 Wind Speed (m/s): 5 Wind Speed (m/s): 2 Chemically dispersible (<3000 cp) Reduced chemical dispersibility Poorly / slowly chemically dispersible (>10000 cp) Sea surface temperature: 13 C Viscosity (cp) Hours Days Page 188 of 306
189 Property: WATER CONTENT Oil Type: HDME 50, 2 C, 2016 Description: Data Source: SINTEF Materials and Chemistry (2016), Weatherin OWModel Surface release - Terminal Oil film thickness: 5 mm Release rate/duration: 1.33 metric tons/minute for 15 minute(s) Pred. date: May. 04, 2017 Wind Speed (m/s): 5 Wind Speed (m/s): Sea surface temperature: 0 C 80 Water content (%) Hours Days Property: WATER CONTENT Oil Type: HDME Description: OWModel Data Source: SINTEF Materials and Chemistry (2016), Weathering data used Surface release - Terminal Oil film thickness: 5 mm Release rate/duration: 1.33 metric tons/minute for 15 minute(s) Pred. date: May. 03, 2017 Wind Speed (m/s): 5 Wind Speed (m/s): Sea surface temperature: 13 C 80 Water content (%) Hours Days Page 189 of 306
190 ULSFO ( ) Property: IGNITABILITY Oil Type: ULSFO 13 C 2017 Description: Data Source: SINTEF Materials and Chemistry (2016), Weatherin OWModel Surface release - Terminal Oil film thickness: 5 mm Release rate/duration: 1.33 metric tons/minute for 15 minute(s) Pred. date: Apr. 27, 2017 Wind Speed (m/s): 5 Wind Speed (m/s): 2 Not ignitable Ignitable 1 Sea surface temperature: 0 C Ignitability index Hours Days 1 Sea surface temperature: 13 C Ignitability index Hours Days Page 190 of 306
191 Property: EVAPORATIVE LOSS Oil Type: ULSFO 13 C 2017 Description: Data Source: SINTEF Materials and Chemistry (2016), Weatherin OWModel Surface release - Terminal Oil film thickness: 5 mm Release rate/duration: 1.33 metric tons/minute for 15 minute(s) Pred. date: May. 03, 2017 Wind Speed (m/s): 5 Wind Speed (m/s): 2 50 Sea surface temperature: 0 C 40 Evaporated (%) Hours Days 50 Sea surface temperature: 13 C 40 Evaporated (%) Hours Days Page 191 of 306
192 Property: FLASH POINT FOR WATER-FREE OIL Oil Type: ULSFO 13 C 2017 Description: Data Source: SINTEF Materials and Chemistry (2016), Weatherin OWModel Surface release - Terminal Oil film thickness: 5 mm Release rate/duration: 1.33 metric tons/minute for 15 minute(s) Pred. date: May. 03, 2017 Wind Speed (m/s): 5 Wind Speed (m/s): 2 No fire hazard Fire hazard in tankage (<60 C) Fire hazard at sea surface (below sea temperature) 200 Sea surface temperature: 0 C 150 Flash Point ( C) Hours Days 200 Sea surface temperature: 13 C 150 Flash Point ( C) Hours Days Based on flash point measurements of weathered, water-free oil residues. Page 192 of 306
193 Property: VISCOSITY OF EMULSION Oil Type: ULSFO 13 C 2017 Description: Data Source: SINTEF Materials and Chemistry (2016), Weatherin OWModel Surface release - Terminal Oil film thickness: 5 mm Release rate/duration: 1.33 metric tons/minute for 15 minute(s) Pred. date: May. 03, 2017 Wind Speed (m/s): 5 Wind Speed (m/s): 2 Chemically dispersible (<4000 cp) Reduced chemical dispersibility Poorly / slowly chemically dispersible (>9000 cp) Sea surface temperature: 0 C Viscosity (cp) Hours Days Sea surface temperature: 13 C Viscosity (cp) Hours Days Based on viscosity measurements carried out at a shear rate of 10 reciprocal seconds. Chemical dispersability information based on experiments under standard laboratory conditions. Page 193 of 306

 CLASSIFICATION Unrestricted CLIENTS REF. Silje Berger NO.")
194 SINTEF Ocean AS Postadresse: Postboks 4762 Torgarden 7465 Trondheim Switchboard: Foretaksregister: NO MVA Project memo Input to OWM and predictions Marine diesel fuel oils and hybrid fuel oils DATE AUTHOR(S) Kaja Cecilie Hellstrøm CLIENT(S) Kystverket (Norwegian Coastal Administation) CLASSIFICATION Unrestricted CLIENTS REF. Silje Berger NO. OF PAGES AND APPENDICES: 112 ABSTRACT Obtained results from the preliminary study (Sørheim and Daling, 2015) and the current study have been used as input to SINTEFs Oil Weathering Model (OWM). This memo provide an overview of the data used as input to the model, as well as predictions for each of the six marine fuel oils; GO, MGO, Rotterdam diesel, WRG, HDME 50 and Shell ULSFO. The predictions are given for three temperatures; 2, 5 and 15 C; and four wind speeds; 2, 5, 10 and 15 m/s. PREPARED BY Kaja Cecilie Hellstrøm APPROVED BY Mimmi Throne-Holst Issued as part of report OC2017 A-123 Page 194 of 306
195 Table of contents 1 OWM predictions GO ( ) Input data Predictions MGO ( ) Input data Predictions Rotterdam diesel ( ) Input data Predictions WRG ( ) Input data Predictions HDME 50 ( ) Input data Predictions ULSFO ( ) Input data Predictions Page 195 of 306
196 1 OWM predictions Obtained results from the laboratory testing has been used as input to SINTEF's Oil Weathering Model (OWM). The model has been used to predict each of the six tested fuel oils behaviour in one standard scenario. The predictions obtained from the SINTEF OWM are useful tools in the oil spill contingency planning related to the expected behaviour of oil on the sea surface, and to evaluate the time window for operational response strategies in a spill operation. The following physical and emulsification properties obtained in the testing have been used as input data to the model: Density Pour point Flash point Viscosities of fresh and the water-free residues (if available) Viscosities of the 50% and 75% w/o emulsions (if available) Water uptake (maximum water content, stability and emulsification rate) The parameters used in the chosen scenario are listed in Table 1-1, while predictions are presented for the individual oils in sub chapters, along with the respective input data. Since a limited number of weathered residues have been available, some data points have been estimated. Table 1-2 shows the various sea states the chosen wind speeds represent. Table 1-1: Parameters for the scenario used for predicting the six oils' behaviour and weathering Parameters Rate Duration of spill Volume spilled Value 1.33 metric tonnes/min 15 minutes 20 metric tonnes Temperature 2, 5 and 15 C Wind speed Time line for predictions 2, 5, 10 and 15 m/s 15 minutes to 5 days after spill Table 1-2: Relationship between wind speed and significant wave height used in the SINTEF OWM Wind speed [m/s] Beaufort wind Wind type Wave height [m] 2 2 Light breeze Gentle to moderate breeze Fresh breeze Strong breeze 3-4 Page 196 of 306
197 2 GO ( ) 2.1 Input data Table 2-1: True boiling point curve used in OWM for GO ( ) Temperature ( C) Volume (%) Table 2-2: Physical-chemical properties for fresh GO ( ) at 13 C Properties of fresh oil Value Density (g/ml) Pour point ( C) -36 Reference temperature ( C) 10 Viscosity at ref. temp. (mpa s = cp) * 3 Asphaltenes (wt. %) 0.01 Flash Point ( C) 71.5 Wax Content (wt. %) 0.01 Dispersible for visc. < Not dispersible for visc. > Maximum water uptake (%) 1 * Measured at shear rate 10s -1 - No data available Page 197 of 306
198 Table 2-3: Results from the emulsifying study and other laboratory analysis, as well as estimated data for GO ) Property Fresh 150 C+ 200 C+ 250 C+ Boiling Point Temp. ( C) Vol. Topped (%) Weight Residue (wt. %) Density (g/ml) Pour point ( C) Flash Point ( C) *Viscosity of water-free residue (mpa s =cp)* *Viscosity of 50% emulsion (mpa s = cp)* *Viscosity of 75% emulsion (mpa s = cp)* *Viscosity of max water (mpa s = cp)* Max. water cont. (vol. %) (T1/2) Halftime for water uptake (hrs) * Measured at shear rate 10s -1 - No data available Page 198 of 306
199 2.2 Predictions Page 199 of 306
200 Page 200 of 306

201 Page 201 of 306

202 Page 202 of 306
203 Page 203 of 306

204 Page 204 of 306
205 Page 205 of 306
206 Page 206 of 306
207 Page 207 of 306
208 Page 208 of 306
209 Property: MASS BALANCE Oil Type: GO 10 PPM S - 10 C 2016 Description: Mongstad refinery, received from Kystverket Data Source: SINTEF Applied Chemistry (2015), Weathering data OWModel Surface release - Terminal Oil film thickness: 0.05 mm Release rate/duration: 1.33 metric tons/minute for 15 minute(s) Pred. date: Jun. 16, 2017 Evaporated Surface Naturally dispersed 100 Temperature: 2 C Wind speed: 2 m/s 80 Mass (%) Hours Days 100 Temperature: 2 C Wind speed: 5 m/s 80 Mass (%) Hours Days Page 209 of 306
210 Property: MASS BALANCE Oil Type: GO 10 PPM S - 10 C 2016 Description: Mongstad refinery, received from Kystverket Data Source: SINTEF Applied Chemistry (2015), Weathering data OWModel Surface release - Terminal Oil film thickness: 0.05 mm Release rate/duration: 1.33 metric tons/minute for 15 minute(s) Pred. date: Jun. 16, 2017 Evaporated Surface Naturally dispersed 100 Temperature: 2 C Wind speed: 10 m/s 80 Mass (%) Hours Days 100 Temperature: 2 C Wind speed: 15 m/s 80 Mass (%) Hours Days Page 210 of 306
211 Property: MASS BALANCE Oil Type: GO 10 PPM S - 10 C 2016 Description: Mongstad refinery, received from Kystverket Data Source: SINTEF Applied Chemistry (2015), Weathering data OWModel Surface release - Terminal Oil film thickness: 0.05 mm Release rate/duration: 1.33 metric tons/minute for 15 minute(s) Pred. date: Jun. 16, 2017 Evaporated Surface Naturally dispersed 100 Temperature: 5 C Wind speed: 2 m/s 80 Mass (%) Hours Days 100 Temperature: 5 C Wind speed: 5 m/s 80 Mass (%) Hours Days Page 211 of 306
212 Property: MASS BALANCE Oil Type: GO 10 PPM S - 10 C 2016 Description: Mongstad refinery, received from Kystverket Data Source: SINTEF Applied Chemistry (2015), Weathering data OWModel Surface release - Terminal Oil film thickness: 0.05 mm Release rate/duration: 1.33 metric tons/minute for 15 minute(s) Pred. date: Jun. 16, 2017 Evaporated Surface Naturally dispersed 100 Temperature: 5 C Wind speed: 10 m/s 80 Mass (%) Hours Days 100 Temperature: 5 C Wind speed: 15 m/s 80 Mass (%) Hours Days Page 212 of 306
213 Property: MASS BALANCE Oil Type: GO 10 PPM S - 10 C 2016 Description: Mongstad refinery, received from Kystverket Data Source: SINTEF Applied Chemistry (2015), Weathering data OWModel Surface release - Terminal Oil film thickness: 0.05 mm Release rate/duration: 1.33 metric tons/minute for 15 minute(s) Pred. date: Jun. 16, 2017 Evaporated Surface Naturally dispersed 100 Temperature: 15 C Wind speed: 2 m/s 80 Mass (%) Hours Days 100 Temperature: 15 C Wind speed: 5 m/s 80 Mass (%) Hours Days Page 213 of 306
214 Property: MASS BALANCE Oil Type: GO 10 PPM S - 10 C 2016 Description: Mongstad refinery, received from Kystverket Data Source: SINTEF Applied Chemistry (2015), Weathering data OWModel Surface release - Terminal Oil film thickness: 0.05 mm Release rate/duration: 1.33 metric tons/minute for 15 minute(s) Pred. date: Jun. 16, 2017 Evaporated Surface Naturally dispersed 100 Temperature: 15 C Wind speed: 10 m/s 80 Mass (%) Hours Days 100 Temperature: 15 C Wind speed: 15 m/s 80 Mass (%) Hours Days The algorithm for prediction of natural dispersion is preliminary and is currently under improvement.model predictions have been field-verified up to 4-5 days. Page 214 of 306
215 3 MGO ( ) 3.1 Input data Table 3-1: True boiling point curve used in OWM for MGO ( ) Temperature ( C) Volume (%) Table 3-2: Physical-chemical properties for fresh MGO ( ) at 13 C Properties of fresh oil Value Density (g/ml) Pour point ( C) -36 Reference temperature ( C) 10 Viscosity at ref. temp. (mpa s = cp) * 6 Asphaltenes (wt. %) 0.02 Flash Point ( C) 62.5 Wax Content (wt. %) 0.81 Dispersible for visc. < - Not dispersible for visc. > - Maximum water uptake (%) 10 * Measured at shear rate 10s -1 - No data available Page 215 of 306
216 Table 3-3: Results from the emulsifying study and other laboratory analysis, as well as estimated data for MGO ( ) Property Fresh 150 C+ 200 C+ 250 C+ Boiling Point Temp. ( C) 0 1,20 8,6 30,6 Vol. Topped (%) ,0 92,0 70,8 Weight Residue (wt. %) 0,852 0,854 0,860 0,868 Density (g/ml) Pour point ( C) 62,5 65,0 90,0 110 Flash Point ( C) *Viscosity of water-free residue (mpa s =cp)* *Viscosity of 50% emulsion (mpa s = cp)* *Viscosity of 75% emulsion (mpa s = cp)* *Viscosity of max water (mpa s = cp)* Max. water cont. (vol. %) (T1/2) Halftime for water uptake (hrs) * Measured at shear rate 10s -1 - No data available Page 216 of 306
217 3.2 Predictions Page 217 of 306
218 Page 218 of 306

219 Page 219 of 306

220 Page 220 of 306
221 Page 221 of 306

222 Page 222 of 306
223 Page 223 of 306
224 Page 224 of 306
225 Page 225 of 306
226 Page 226 of 306
227 Property: MASS BALANCE Oil Type: MGO 500 PPM S Description: Esso Slagen Data Source: SINTEF Applied Chemistry (2015), Weathering data OWModel Surface release - Terminal Oil film thickness: 0.05 mm Release rate/duration: 1.33 metric tons/minute for 15 minute(s) Pred. date: Jun. 16, 2017 Evaporated Surface Naturally dispersed 100 Temperature: 2 C Wind speed: 2 m/s 80 Mass (%) Hours Days 100 Temperature: 2 C Wind speed: 5 m/s 80 Mass (%) Hours Days Page 227 of 306
228 Property: MASS BALANCE Oil Type: MGO 500 PPM S Description: Esso Slagen Data Source: SINTEF Applied Chemistry (2015), Weathering data OWModel Surface release - Terminal Oil film thickness: 0.05 mm Release rate/duration: 1.33 metric tons/minute for 15 minute(s) Pred. date: Jun. 16, 2017 Evaporated Surface Naturally dispersed 100 Temperature: 2 C Wind speed: 10 m/s 80 Mass (%) Hours Days 100 Temperature: 2 C Wind speed: 15 m/s 80 Mass (%) Hours Days Page 228 of 306
229 Property: MASS BALANCE Oil Type: MGO 500 PPM S Description: Esso Slagen Data Source: SINTEF Applied Chemistry (2015), Weathering data OWModel Surface release - Terminal Oil film thickness: 0.05 mm Release rate/duration: 1.33 metric tons/minute for 15 minute(s) Pred. date: Jun. 16, 2017 Evaporated Surface Naturally dispersed 100 Temperature: 5 C Wind speed: 2 m/s 80 Mass (%) Hours Days 100 Temperature: 5 C Wind speed: 5 m/s 80 Mass (%) Hours Days Page 229 of 306
230 Property: MASS BALANCE Oil Type: MGO 500 PPM S Description: Esso Slagen Data Source: SINTEF Applied Chemistry (2015), Weathering data OWModel Surface release - Terminal Oil film thickness: 0.05 mm Release rate/duration: 1.33 metric tons/minute for 15 minute(s) Pred. date: Jun. 16, 2017 Evaporated Surface Naturally dispersed 100 Temperature: 5 C Wind speed: 10 m/s 80 Mass (%) Hours Days 100 Temperature: 5 C Wind speed: 15 m/s 80 Mass (%) Hours Days Page 230 of 306
231 Property: MASS BALANCE Oil Type: MGO 500 PPM S Description: Esso Slagen Data Source: SINTEF Applied Chemistry (2015), Weathering data OWModel Surface release - Terminal Oil film thickness: 0.05 mm Release rate/duration: 1.33 metric tons/minute for 15 minute(s) Pred. date: Jun. 16, 2017 Evaporated Surface Naturally dispersed 100 Temperature: 15 C Wind speed: 2 m/s 80 Mass (%) Hours Days 100 Temperature: 15 C Wind speed: 5 m/s 80 Mass (%) Hours Days Page 231 of 306
232 Property: MASS BALANCE Oil Type: MGO 500 PPM S Description: Esso Slagen Data Source: SINTEF Applied Chemistry (2015), Weathering data OWModel Surface release - Terminal Oil film thickness: 0.05 mm Release rate/duration: 1.33 metric tons/minute for 15 minute(s) Pred. date: Jun. 16, 2017 Evaporated Surface Naturally dispersed 100 Temperature: 15 C Wind speed: 10 m/s 80 Mass (%) Hours Days 100 Temperature: 15 C Wind speed: 15 m/s 80 Mass (%) Hours Days The algorithm for prediction of natural dispersion is preliminary and is currently under improvement.model predictions have been field-verified up to 4-5 days. Page 232 of 306
233 4 Rotterdam diesel ( ) 4.1 Input data Table 4-1: True boiling point curve used in OWM for Rotterdam diesel ( ) Temperature ( C) Volume (%) Table 4-2: Physical-chemical properties for fresh Rotterdam diesel ( ) at 13 C Properties of fresh oil Value Density (g/ml) Pour point ( C) -36 Reference temperature ( C) 13 Viscosity at ref. temp. (mpa s = cp) * 12 Asphaltenes (wt. %) 0.02 Flash Point ( C) 82.5 Wax Content (wt. %) 3.11 Dispersible for visc. < - Not dispersible for visc. > - Maximum water uptake (%) 5 * Measured at shear rate 10s -1 - No data available Page 233 of 306
234 Table 4-3: Results from the emulsifying study and other laboratory analysis, as well as estimated data for Rotterdam diesel ( ) Property Fresh 150 C+ 200 C+ 250 C+ Boiling Point Temp. ( C) Vol. Topped (%) 0 0,1 4 6,1 Weight Residue (wt. %) , Density (g/ml) Pour point ( C) Flash Point ( C) *Viscosity of water-free residue (mpa s =cp)* *Viscosity of 50% emulsion (mpa s = cp)* *Viscosity of 75% emulsion (mpa s = cp)* *Viscosity of max water (mpa s = cp)* Max. water cont. (vol. %) (T1/2) Halftime for water uptake (hrs) Stability ratio * Measured at shear rate 10s -1 - No data available Page 234 of 306
235 4.2 Predictions Page 235 of 306
236 Page 236 of 306
237 Page 237 of 306
238 Page 238 of 306
239 Page 239 of 306

240 Page 240 of 306
241 Page 241 of 306
242 Page 242 of 306
243 Page 243 of 306
244 Page 244 of 306
245 Property: MASS BALANCE Oil Type: ROTTERDAM DIESEL 2016 Description: Data Source: SINTEF Materials and Chemistry (2016), Weatherin OWModel Surface release - Terminal Oil film thickness: 0.05 mm Release rate/duration: 1.33 metric tons/minute for 15 minute(s) Pred. date: Jun. 19, 2017 Evaporated Surface Naturally dispersed 100 Temperature: 2 C Wind speed: 2 m/s 80 Mass (%) Hours Days 100 Temperature: 2 C Wind speed: 5 m/s 80 Mass (%) Hours Days Page 245 of 306
246 Property: MASS BALANCE Oil Type: ROTTERDAM DIESEL 2016 Description: Data Source: SINTEF Materials and Chemistry (2016), Weatherin OWModel Surface release - Terminal Oil film thickness: 0.05 mm Release rate/duration: 1.33 metric tons/minute for 15 minute(s) Pred. date: Jun. 19, 2017 Evaporated Surface Naturally dispersed 100 Temperature: 2 C Wind speed: 10 m/s 80 Mass (%) Hours Days 100 Temperature: 2 C Wind speed: 15 m/s 80 Mass (%) Hours Days Page 246 of 306
247 Property: MASS BALANCE Oil Type: ROTTERDAM DIESEL 2016 Description: Data Source: SINTEF Materials and Chemistry (2016), Weatherin OWModel Surface release - Terminal Oil film thickness: 0.05 mm Release rate/duration: 1.33 metric tons/minute for 15 minute(s) Pred. date: Jun. 19, 2017 Evaporated Surface Naturally dispersed 100 Temperature: 5 C Wind speed: 2 m/s 80 Mass (%) Hours Days 100 Temperature: 5 C Wind speed: 5 m/s 80 Mass (%) Hours Days Page 247 of 306
248 Property: MASS BALANCE Oil Type: ROTTERDAM DIESEL 2016 Description: Data Source: SINTEF Materials and Chemistry (2016), Weatherin OWModel Surface release - Terminal Oil film thickness: 0.05 mm Release rate/duration: 1.33 metric tons/minute for 15 minute(s) Pred. date: Jun. 19, 2017 Evaporated Surface Naturally dispersed 100 Temperature: 5 C Wind speed: 10 m/s 80 Mass (%) Hours Days 100 Temperature: 5 C Wind speed: 15 m/s 80 Mass (%) Hours Days Page 248 of 306
249 Property: MASS BALANCE Oil Type: ROTTERDAM DIESEL 2016 Description: Data Source: SINTEF Materials and Chemistry (2016), Weatherin OWModel Surface release - Terminal Oil film thickness: 0.05 mm Release rate/duration: 1.33 metric tons/minute for 15 minute(s) Pred. date: Jun. 19, 2017 Evaporated Surface Naturally dispersed 100 Temperature: 15 C Wind speed: 2 m/s 80 Mass (%) Hours Days 100 Temperature: 15 C Wind speed: 5 m/s 80 Mass (%) Hours Days Page 249 of 306
250 Property: MASS BALANCE Oil Type: ROTTERDAM DIESEL 2016 Description: Data Source: SINTEF Materials and Chemistry (2016), Weatherin OWModel Surface release - Terminal Oil film thickness: 0.05 mm Release rate/duration: 1.33 metric tons/minute for 15 minute(s) Pred. date: Jun. 19, 2017 Evaporated Surface Naturally dispersed 100 Temperature: 15 C Wind speed: 10 m/s 80 Mass (%) Hours Days 100 Temperature: 15 C Wind speed: 15 m/s 80 Mass (%) Hours Days The algorithm for prediction of natural dispersion is preliminary and is currently under improvement.model predictions have been field-verified up to 4-5 days. Page 250 of 306
251 5 WRG ( ) 5.1 Input data Table 5-1: True boiling point curve used in OWM for WRG ( ) Temperature ( C) Volume (%) Table 5-2: Physical-chemical properties for fresh WRG ( ) at 10 C Properties of fresh oil Value Density (g/ml) Pour point ( C) -24 Reference temperature ( C) 10 Viscosity at ref. temp. (mpa s = cp) * 114 Asphaltenes (wt. %) 0.01 Flash Point ( C) 115 Wax Content (wt. %) 4.74 Dispersible for visc. < 300 Not dispersible for visc. > - Maximum water uptake (%) 80 * Measured at shear rate 10s -1 - No data available Page 251 of 306
252 Table 5-3: Results from the emulsifying study and other laboratory analysis, as well as estimated data for WRG at 10/13 C Property Fresh 150 C+ 200 C+ 250 C+ Boiling Point Temp. ( C) Vol. Topped (%) Weight Residue (wt. %) Density (g/ml) Pour point ( C) Flash Point ( C) *Viscosity of water-free residue (mpa s =cp)* *Viscosity of 50% emulsion (mpa s = cp)* *Viscosity of 75% emulsion (mpa s = cp)* *Viscosity of max water (mpa s = cp)* Max. water cont. (vol. %) (T1/2) Halftime for water uptake (hrs) Stability ratio * Measured at shear rate 10s -1 - No data available Table 5-4: Physical-chemical properties for fresh WRG ( ) at 2 C Properties of fresh oil Value Density (g/ml) Pour point ( C) -24 Reference temperature ( C) 2 Viscosity at ref. temp. (mpa s = cp) * 179 Asphaltenes (wt. %) 0.01 Flash Point ( C) 115 Wax Content (wt. %) 4.74 Dispersible for visc. < 300 Not dispersible for visc. > - Maximum water uptake (%) 80 * Measured at shear rate 10s -1 - No data available Page 252 of 306
253 Table 5-5: Results from the emulsifying study and other laboratory analysis, as well as estimated data for WRG ( ) at 2 C Property Fresh 150 C+ 200 C+ 250 C+ Boiling Point Temp. ( C) Vol. Topped (%) Weight Residue (wt. %) Density (g/ml) Pour point ( C) Flash Point ( C) *Viscosity of water-free residue (mpa s =cp)* *Viscosity of 50% emulsion (mpa s = cp)* *Viscosity of 75% emulsion (mpa s = cp)* *Viscosity of max water (mpa s = cp)* Max. water cont. (vol. %) (T1/2) Halftime for water uptake (hrs) Stability ratio * Measured at shear rate 10s -1 - No data available Page 253 of 306
254 5.2 Predictions Page 254 of 306
255 Page 255 of 306

256 Page 256 of 306

257 Page 257 of 306

258 Page 258 of 306

259 Page 259 of 306
260 Page 260 of 306
261 Page 261 of 306
262 Page 262 of 306
263 Page 263 of 306
264 Property: MASS BALANCE Oil Type: WIDE RANGE GAS OIL C Description: Mongstad refinery recieved from Kystverket Data Source: SINTEF Applied Chemistry (2015), Weathering data OWModel Surface release - Terminal Oil film thickness: 0.5 mm Release rate/duration: 1.33 metric tons/minute for 15 minute(s) Pred. date: Jun. 19, 2017 Evaporated Surface Naturally dispersed 100 Temperature: 2 C Wind speed: 2 m/s 80 Mass (%) Hours Days 100 Temperature: 2 C Wind speed: 5 m/s 80 Mass (%) Hours Days Page 264 of 306
265 Property: MASS BALANCE Oil Type: WIDE RANGE GAS OIL C Description: Mongstad refinery recieved from Kystverket Data Source: SINTEF Applied Chemistry (2015), Weathering data OWModel Surface release - Terminal Oil film thickness: 0.5 mm Release rate/duration: 1.33 metric tons/minute for 15 minute(s) Pred. date: Jun. 19, 2017 Evaporated Surface Naturally dispersed 100 Temperature: 2 C Wind speed: 10 m/s 80 Mass (%) Hours Days 100 Temperature: 2 C Wind speed: 15 m/s 80 Mass (%) Hours Days Page 265 of 306
266 Property: MASS BALANCE Oil Type: WIDE RANGE GAS OIL C Description: Mongstad refinery recieved from Kystverket Data Source: SINTEF Applied Chemistry (2015), Weathering data OWModel Surface release - Terminal Oil film thickness: 0.5 mm Release rate/duration: 1.33 metric tons/minute for 15 minute(s) Pred. date: Jun. 19, 2017 Evaporated Surface Naturally dispersed 100 Temperature: 5 C Wind speed: 2 m/s 80 Mass (%) Hours Days 100 Temperature: 5 C Wind speed: 5 m/s 80 Mass (%) Hours Days Page 266 of 306
267 Property: MASS BALANCE Oil Type: WIDE RANGE GAS OIL C Description: Mongstad refinery recieved from Kystverket Data Source: SINTEF Applied Chemistry (2015), Weathering data OWModel Surface release - Terminal Oil film thickness: 0.5 mm Release rate/duration: 1.33 metric tons/minute for 15 minute(s) Pred. date: Jun. 19, 2017 Evaporated Surface Naturally dispersed 100 Temperature: 5 C Wind speed: 10 m/s 80 Mass (%) Hours Days 100 Temperature: 5 C Wind speed: 15 m/s 80 Mass (%) Hours Days The algorithm for prediction of natural dispersion is preliminary and is currently under improvement.model predictions have been field-verified up to 4-5 days. Page 267 of 306
268 Property: MASS BALANCE Oil Type: WIDE RANGE GAS OIL 10 C 2016 Description: Mongstad refinery recieved from Kystverket Data Source: SINTEF Applied Chemistry (2015), Weathering data OWModel Surface release - Terminal Oil film thickness: 0.5 mm Release rate/duration: 1.33 metric tons/minute for 15 minute(s) Pred. date: Jun. 19, 2017 Evaporated Surface Naturally dispersed 100 Temperature: 15 C Wind speed: 2 m/s 80 Mass (%) Hours Days 100 Temperature: 15 C Wind speed: 5 m/s 80 Mass (%) Hours Days Page 268 of 306
269 Property: MASS BALANCE Oil Type: WIDE RANGE GAS OIL 10 C 2016 Description: Mongstad refinery recieved from Kystverket Data Source: SINTEF Applied Chemistry (2015), Weathering data OWModel Surface release - Terminal Oil film thickness: 0.5 mm Release rate/duration: 1.33 metric tons/minute for 15 minute(s) Pred. date: Jun. 19, 2017 Evaporated Surface Naturally dispersed 100 Temperature: 15 C Wind speed: 10 m/s 80 Mass (%) Hours Days 100 Temperature: 15 C Wind speed: 15 m/s 80 Mass (%) Hours Days The algorithm for prediction of natural dispersion is preliminary and is currently under improvement.model predictions have been field-verified up to 4-5 days. Page 269 of 306
270 6 HDME 50 ( ) 6.1 Input data Table 6-1: True boiling point curve used in OWM for HDME 50 ( ) Temperature ( C) Volume (%) Table 6-2: Physical-chemical properties for fresh HDME 50 at 13 C ( ) Properties of fresh oil Value Density (g/ml) Pour point ( C) 12 Reference temperature ( C) 13 Viscosity at ref. temp. (mpa s = cp) * 1005 Asphaltenes (wt. %) 0.06 Flash Point ( C) 186 Wax Content (wt. %) 9.47 Dispersible for visc. < 3000 Not dispersible for visc. > Maximum water uptake (%) 60 * Measured at shear rate 10s -1 - No data available Page 270 of 306
271 Table 6-3: Results from the emulsifying study and other laboratory analysis, as well as estimated data for HDME 50 ( ) at 13 C Property Fresh 150 C+ 200 C+ 250 C+ Boiling Point Temp. ( C) Vol. Topped (%) Weight Residue (wt. %) Density (g/ml) Pour point ( C) Flash Point ( C) *Viscosity of water-free residue (mpa s =cp)* *Viscosity of 50% emulsion (mpa s = cp)* *Viscosity of 75% emulsion (mpa s = cp)* *Viscosity of max water (mpa s = cp)* Max. water cont. (vol. %) (T1/2) Halftime for water uptake (hrs) Stability ratio * Measured at shear rate 10s -1 Table 6-4: Results from the emulsifying study and other laboratory analysis, as well as estimated data for HDME 50 ( ) at 2 C Properties of fresh oil Value Density (g/ml) Pour point ( C) 12 Reference temperature ( C) 2 Viscosity at ref. temp. (mpa s = cp) * Asphaltenes (wt. %) 0.06 Flash Point ( C) 186 Wax Content (wt. %) 9.47 Dispersible for visc. < 3000 Not dispersible for visc. > Maximum water uptake (%) 60 * Measured at shear rate 10s -1 - No data available Page 271 of 306
272 Table 6-5: Results from the emulsifying study and other laboratory analysis, as well as estimated data for HDME 50 ( ) at 2 C Property Fresh 150 C+ 200 C+ 250 C+ Boiling Point Temp. ( C) Vol. Topped (%) Weight Residue (wt. %) Density (g/ml) Pour point ( C) Flash Point ( C) *Viscosity of water-free residue (mpa s =cp)* *Viscosity of 50% emulsion (mpa s = cp)* *Viscosity of 75% emulsion (mpa s = cp)* *Viscosity of max water (mpa s = cp)* Max. water cont. (vol. %) (T1/2) Halftime for water uptake (hrs) Stability ratio * Measured at shear rate 10s -1 Page 272 of 306
273 6.2 Predictions Page 273 of 306
274 Page 274 of 306

275 Page 275 of 306

276 Page 276 of 306
277 Page 277 of 306

278 Page 278 of 306
279 Page 279 of 306

280 Page 280 of 306
281 Page 281 of 306
282 Page 282 of 306
283 Property: MASS BALANCE Oil Type: HDME 50, 2 C, 2016 Description: Data Source: SINTEF Materials and Chemistry (2016), Weatherin OWModel Surface release - Terminal Oil film thickness: 0.5 mm Release rate/duration: 1.33 metric tons/minute for 15 minute(s) Pred. date: Jun. 19, 2017 Evaporated Surface Naturally dispersed 100 Temperature: 2 C Wind speed: 2 m/s 80 Mass (%) Hours Days 100 Temperature: 2 C Wind speed: 5 m/s 80 Mass (%) Hours Days Page 283 of 306
284 Property: MASS BALANCE Oil Type: HDME 50, 2 C, 2016 Description: Data Source: SINTEF Materials and Chemistry (2016), Weatherin OWModel Surface release - Terminal Oil film thickness: 0.5 mm Release rate/duration: 1.33 metric tons/minute for 15 minute(s) Pred. date: Jun. 19, 2017 Evaporated Surface Naturally dispersed 100 Temperature: 2 C Wind speed: 10 m/s 80 Mass (%) Hours Days 100 Temperature: 2 C Wind speed: 15 m/s 80 Mass (%) Hours Days Page 284 of 306
285 Property: MASS BALANCE Oil Type: HDME 50, 2 C, 2016 Description: Data Source: SINTEF Materials and Chemistry (2016), Weatherin OWModel Surface release - Terminal Oil film thickness: 0.5 mm Release rate/duration: 1.33 metric tons/minute for 15 minute(s) Pred. date: Jun. 19, 2017 Evaporated Surface Naturally dispersed 100 Temperature: 5 C Wind speed: 2 m/s 80 Mass (%) Hours Days 100 Temperature: 5 C Wind speed: 5 m/s 80 Mass (%) Hours Days Page 285 of 306
286 Property: MASS BALANCE Oil Type: HDME 50, 2 C, 2016 Description: Data Source: SINTEF Materials and Chemistry (2016), Weatherin OWModel Surface release - Terminal Oil film thickness: 0.5 mm Release rate/duration: 1.33 metric tons/minute for 15 minute(s) Pred. date: Jun. 19, 2017 Evaporated Surface Naturally dispersed 100 Temperature: 5 C Wind speed: 10 m/s 80 Mass (%) Hours Days 100 Temperature: 5 C Wind speed: 15 m/s 80 Mass (%) Hours Days The algorithm for prediction of natural dispersion is preliminary and is currently under improvement.model predictions have been field-verified up to 4-5 days. Page 286 of 306
287 Property: MASS BALANCE Oil Type: HDME Description: Data Source: SINTEF Materials and Chemistry (2016), Weatherin OWModel Surface release - Terminal Oil film thickness: 0.5 mm Release rate/duration: 1.33 metric tons/minute for 15 minute(s) Pred. date: Jun. 19, 2017 Evaporated Surface Naturally dispersed 100 Temperature: 15 C Wind speed: 2 m/s 80 Mass (%) Hours Days 100 Temperature: 15 C Wind speed: 5 m/s 80 Mass (%) Hours Days Page 287 of 306
288 Property: MASS BALANCE Oil Type: HDME Description: Data Source: SINTEF Materials and Chemistry (2016), Weatherin OWModel Surface release - Terminal Oil film thickness: 0.5 mm Release rate/duration: 1.33 metric tons/minute for 15 minute(s) Pred. date: Jun. 19, 2017 Evaporated Surface Naturally dispersed 100 Temperature: 15 C Wind speed: 10 m/s 80 Mass (%) Hours Days 100 Temperature: 15 C Wind speed: 15 m/s 80 Mass (%) Hours Days The algorithm for prediction of natural dispersion is preliminary and is currently under improvement.model predictions have been field-verified up to 4-5 days. Page 288 of 306
289 7 ULSFO ( ) 7.1 Input data Table 7-1: True boiling point curve used in OWM for ULSFO ( ). Temperature ( C) Volume (%) Table 7-2: Physical-chemical properties for fresh ULSFO ( ) at 13 C Properties of fresh oil Value Density (g/ml) Pour point ( C) 24 Reference temperature ( C) 13 Viscosity at ref. temp. (mpa s = cp) * 4300 Asphaltenes (wt. %) 0.15 Flash Point ( C) 75 Wax Content (wt. %) 13.3 Dispersible for visc. < 4000 Not dispersible for visc. > 9000 Maximum water uptake (%) - * Measured at shear rate 10s -1 - No data available Page 289 of 306
290 Table 7-3: Results from the emulsifying study and other laboratory analysis, as well as estimated data for ULSFO ( ) Property Fresh 150 C+ 200 C+ 250 C+ Boiling Point Temp. ( C) Vol. Topped (%) Weight Residue (wt. %) Density (g/ml) Pour point ( C) Flash Point ( C) *Viscosity of water-free residue (mpa s =cp)* *Viscosity of 50% emulsion (mpa s = cp)* *Viscosity of 75% emulsion (mpa s = cp)* *Viscosity of max water (mpa s = cp)* Max. water cont. (vol. %) (T1/2) Halftime for water uptake (hrs) Stability ratio * Measured at shear rate 10s -1 Page 290 of 306
291 7.2 Predictions Page 291 of 306
292 Page 292 of 306
293 Page 293 of 306

294 Page 294 of 306
295 Page 295 of 306
296 Page 296 of 306

297 Page 297 of 306

298 Page 298 of 306
Subsea injeksjon av dispergeringsmidler Er eksisterende metoder for screening & godkjenning av produkter relevante?
 Beredskapsforum Miljødirektoratet Helsfyr 9. april 2014 Subsea injeksjon av dispergeringsmidler Er eksisterende metoder for screening & godkjenning av produkter relevante? Per Johan Brandvik Seniorforsker
Rapport. Dispergerbarhet av bunkersoljer. Prosjekt Statlig dispergeringsberedskap for Kystverket
 A26179 - Åpen Rapport Dispergerbarhet av bunkersoljer Prosjekt Statlig dispergeringsberedskap for Kystverket Forfatter(e) Kristin Rist Sørheim, Per S. Daling, Thor-Arne Pettersen og Marius Johnsen SINTEF
FORFATTER(E) OPPDRAGSGIVER(E) BP og Phillips Petroleum. STF66 A01090 Åpen Hans Grüner, Ingrid Landmark
 OPPDRAGSGIVER(E) BP og Phillips Petroleum. STF66 A01090 Åpen Hans Grüner, Ingrid Landmark") SINTEF RAPPORT TITTEL SINTEF Kjemi Postadresse: 7465 Trondheim Besøksadresse: S.P. Andersens vei 15A Telefon: 73 59 20 80 / 12 12 Telefaks: 73 59 70 51 Foretaksregisteret: NO 948 007 029 MVA Ekofiskoljene,
SINTEF RAPPORT TITTEL SINTEF Kjemi Postadresse: 7465 Trondheim Besøksadresse: S.P. Andersens vei 15A Telefon: 73 59 20 80 / 12 12 Telefaks: 73 59 70 51 Foretaksregisteret: NO 948 007 029 MVA Ekofiskoljene,
PROSJEKTNR. DATO SAKSBEARBEIDER/FORFATTER ANTALL SIDER. 80402684 2010-04-12 Svein Ramstad 8
 NOTAT GJELDER Testing av egenskaper til sorbenten SpillSorb SA SINTEF Materialer og kjemi Postadresse: 7465 Trondheim Besøksadresse: Brattørkaia 17C, 4. etg. Telefon: 4 373 Telefaks: 93 773 GÅR TIL Ole
SINTEF. OC2017 A Restricted. Rapport. Forurensningsprøver fra Heines fyr. Forfatter Kjersti Almås. Foto fra Wikipedia.
 SINTEF OC2017 A-228 - Restricted Rapport Forurensningsprøver fra Heines fyr Forfatter Kjersti Almås Foto fra Wikipedia SINTEF Ocean AS 2017-11-22 SINTEF SINTEF Ocean AS Postadresse: Postboks 4762 Torgard
FORFATTER(E) OPPDRAGSGIVER(E) Esso Norge AS ELEKTRONISK ARKIVKODE PROSJEKTLEDER (NAVN, SIGN.) VERIFISERT AV (NAVN, SIGN.)
 OPPDRAGSGIVER(E) Esso Norge AS ELEKTRONISK ARKIVKODE PROSJEKTLEDER (NAVN, SIGN.) VERIFISERT AV (NAVN, SIGN.)") SINTEF RAPPORT TITTEL SINTEF Kjemi Postadresse: 7034 Trondheim Besøksadresse: S.P. Andersens vei 15A Telefon: 73 59 28 73 Telefaks: 73 59 70 51 Foretaksnr.: NO 948 007 029 MVA Jotunoljene Elli South, Tau
SINTEF RAPPORT TITTEL SINTEF Kjemi Postadresse: 7034 Trondheim Besøksadresse: S.P. Andersens vei 15A Telefon: 73 59 28 73 Telefaks: 73 59 70 51 Foretaksnr.: NO 948 007 029 MVA Jotunoljene Elli South, Tau
Test av skive-, børste- og adhesjonsopptaker i diesel- og hybridoljer
 Test av skive-, børste- og adhesjonsopptaker i diesel- og hybridoljer Tittel: Test av skive-, børste- og adhesjonsopptaker i diesel- og hybridoljer Forfattere: Hanne Solem Holt, Bjørn Ronny Frost, Hilde
FORFATTER(E) OPPDRAGSGIVER(E) Statoil GRADER. DENNE SIDE ISBN PROSJEKTNR. ANTALL SIDER OG BILAG
 OPPDRAGSGIVER(E) Statoil GRADER. DENNE SIDE ISBN PROSJEKTNR. ANTALL SIDER OG BILAG") SINTEF RAPPORT TITTEL SINTEF Kjemi Postadresse: 7465 Trondheim Besøksadresse: S.P. Andersens vei 15A Telefon: 73 59 2 8 / 12 12 Telefaks: 73 59 7 51 Foretaksregisteret: NO 948 7 29 MVA Heidrun oljene Egenskaper
SINTEF RAPPORT TITTEL SINTEF Kjemi Postadresse: 7465 Trondheim Besøksadresse: S.P. Andersens vei 15A Telefon: 73 59 2 8 / 12 12 Telefaks: 73 59 7 51 Foretaksregisteret: NO 948 7 29 MVA Heidrun oljene Egenskaper
FORFATTER(E) OPPDRAGSGIVER(E) BP / Amoco GRADER. DENNE SIDE ISBN PROSJEKTNR. ANTALL SIDER OG BILAG. Fortrolig 661158.00 65
 OPPDRAGSGIVER(E) BP / Amoco GRADER. DENNE SIDE ISBN PROSJEKTNR. ANTALL SIDER OG BILAG. Fortrolig 661158.00 65") SINTEF RAPPORT TITTEL SINTEF Kjemi Postadresse: 7465 Trondheim Besøksadresse: S.P. Andersens vei 15A Telefon: 73 59 20 80 / 12 12 Telefaks: 73 59 70 51 Foretaksregisteret: NO 948 007 029 MVA Oppdatert
SINTEF RAPPORT TITTEL SINTEF Kjemi Postadresse: 7465 Trondheim Besøksadresse: S.P. Andersens vei 15A Telefon: 73 59 20 80 / 12 12 Telefaks: 73 59 70 51 Foretaksregisteret: NO 948 007 029 MVA Oppdatert
Rapport. Ivar Aasen oljen - Kartlegging av forvitringsegenskaper, dispergerbarhet, egenfarge og spredningsegenskaper
 SINTEF A21165 - Åpen Rapport Ivar Aasen oljen - Kartlegging av forvitringsegenskaper, dispergerbarhet, egenfarge og spredningsegenskaper Egenskaper til oljen relatert til oljevernberedskap Forfatter(e)
FORFATTER(E) Kristin Rist Sørheim OPPDRAGSGIVER(E) StatoilHydro GRADER. DENNE SIDE ISBN PROSJEKTNR. ANTALL SIDER OG BILAG
 Kristin Rist Sørheim OPPDRAGSGIVER(E) StatoilHydro GRADER. DENNE SIDE ISBN PROSJEKTNR. ANTALL SIDER OG BILAG") TITTEL SINTEF RAPPORT SINTEF Materialer og kjemi Postadresse: 7465 Trondheim Besøksadresse: Brattørkaia 17B, 4etg. Telefon: 4000 3730 Telefaks: 930 70 730 Foretaksregisteret: NO 948 007 029 MVA Vilje Kartlegging
TITTEL SINTEF RAPPORT SINTEF Materialer og kjemi Postadresse: 7465 Trondheim Besøksadresse: Brattørkaia 17B, 4etg. Telefon: 4000 3730 Telefaks: 930 70 730 Foretaksregisteret: NO 948 007 029 MVA Vilje Kartlegging
Fagseminar med fokus på dispergering som beredskapstiltak
 NOFO Fagseminar med fokus på dispergering som beredskapstiltak Ståle Jensen (Miljørådgiver) NOFO 15. desember 2011 Dispergering - Historikk og status (Torrey Canyon) (Braer) 1967 ~1975 1993 2005 Hydrokarbonbasert
FORFATTER(E) OPPDRAGSGIVER(E) Statoil OPPDRAGSGIVERS REF. Solbjørg Hidle PROSJEKTLEDER (NAVN, SIGN.) Ivar Singsaas
 OPPDRAGSGIVER(E) Statoil OPPDRAGSGIVERS REF. Solbjørg Hidle PROSJEKTLEDER (NAVN, SIGN.) Ivar Singsaas") TITTEL SINTEF RAPPORT SINTEF Kjemi Forvitringsegenskaper for Huldra kondensat. Postadresse: 7034 Trondheim Besøksadresse: S.P. Andersens v 15 b Telefon: 73 59 28 73 Telefaks: 73 59 70 51 Foretaksnr: NO
TITTEL SINTEF RAPPORT SINTEF Kjemi Forvitringsegenskaper for Huldra kondensat. Postadresse: 7034 Trondheim Besøksadresse: S.P. Andersens v 15 b Telefon: 73 59 28 73 Telefaks: 73 59 70 51 Foretaksnr: NO
FORFATTER(E) Tove Strøm og Per S. Daling OPPDRAGSGIVER(E) Norsk Hydro ASA GRADER. DENNE SIDE ISBN PROSJEKTNR. ANTALL SIDER OG BILAG
 Tove Strøm og Per S. Daling OPPDRAGSGIVER(E) Norsk Hydro ASA GRADER. DENNE SIDE ISBN PROSJEKTNR. ANTALL SIDER OG BILAG") TITTEL SINTEF RAPPORT SINTEF Kjemi Postadresse: 7034 Trondheim Besøksadresse: S.P. Andersens vei 15A Telefon: 73 59 28 73 Telefaks: 73 59 70 51 Foretaksnr.: NO 948 007 029 MVA Forvitringsegenskaper på
TITTEL SINTEF RAPPORT SINTEF Kjemi Postadresse: 7034 Trondheim Besøksadresse: S.P. Andersens vei 15A Telefon: 73 59 28 73 Telefaks: 73 59 70 51 Foretaksnr.: NO 948 007 029 MVA Forvitringsegenskaper på
In-situ brenning (ISB) av olje - status, FOU initiativer og operasjonalisering
 av olje - status, FOU initiativer og operasjonalisering") Beredskapsforum, Oslo 10. mars 2015 In-situ brenning (ISB) av olje - status, FOU initiativer og operasjonalisering Per S. Daling, Seniorforsker, Per Johan Brandvik, Dr.Scient. Seniorforsker/Professor (per.brandvik@sintef.no)
Beredskapsforum, Oslo 10. mars 2015 In-situ brenning (ISB) av olje - status, FOU initiativer og operasjonalisering Per S. Daling, Seniorforsker, Per Johan Brandvik, Dr.Scient. Seniorforsker/Professor (per.brandvik@sintef.no)
FORFATTER(E) OPPDRAGSGIVER(E) Norsk Hydro ASA OPPDRAGSGIVERS REF. Per Erik Nilsen PROSJEKTLEDER (NAVN, SIGN.) Ivar Singsaas
 OPPDRAGSGIVER(E) Norsk Hydro ASA OPPDRAGSGIVERS REF. Per Erik Nilsen PROSJEKTLEDER (NAVN, SIGN.) Ivar Singsaas") SINTEF RAPPORT TITTEL SINTEF Kjemi Forvitringsegenskaper på sjøen og kjemisk dispergerbarhet for Njord råolje. Postadresse: 7034 Trondheim Besøksadresse: S.P. Andersens v 15 b Telefon: 73 59 28 73 Telefaks:
SINTEF RAPPORT TITTEL SINTEF Kjemi Forvitringsegenskaper på sjøen og kjemisk dispergerbarhet for Njord råolje. Postadresse: 7034 Trondheim Besøksadresse: S.P. Andersens v 15 b Telefon: 73 59 28 73 Telefaks:
FORFATTER(E) OPPDRAGSGIVER(E) Saga Petroleum ASA OPPDRAGSGIVERS REF. Jon Rytter Hasle PROSJEKTLEDER (NAVN, SIGN.) Ivar Singsaas
 OPPDRAGSGIVER(E) Saga Petroleum ASA OPPDRAGSGIVERS REF. Jon Rytter Hasle PROSJEKTLEDER (NAVN, SIGN.) Ivar Singsaas") TITTEL SINTEF RAPPORT SINTEF Kjemi Postadresse: 7034 Trondheim Besøksadresse: S.P. Andersens v 15 b Telefon: 73 59 28 73 Telefaks: 73 59 70 51 Foretaksnr: NO 948 007 029 MVA Forvitringsegenskaper Lavrans
TITTEL SINTEF RAPPORT SINTEF Kjemi Postadresse: 7034 Trondheim Besøksadresse: S.P. Andersens v 15 b Telefon: 73 59 28 73 Telefaks: 73 59 70 51 Foretaksnr: NO 948 007 029 MVA Forvitringsegenskaper Lavrans
FORFATTER(E) OPPDRAGSGIVER(E) Statoil GRADER. DENNE SIDE ISBN PROSJEKTNR. ANTALL SIDER OG BILAG
 OPPDRAGSGIVER(E) Statoil GRADER. DENNE SIDE ISBN PROSJEKTNR. ANTALL SIDER OG BILAG") SINTEF RAPPORT TITTEL SINTEF Kjemi Postadresse: 7465 Trondheim Besøksadresse: S.P. Andersens vei 15A Telefon: 73 59 20 80 / 12 12 Telefaks: 73 59 70 51 Foretaksregisteret: NO 948 007 029 MVA Statfjord
SINTEF RAPPORT TITTEL SINTEF Kjemi Postadresse: 7465 Trondheim Besøksadresse: S.P. Andersens vei 15A Telefon: 73 59 20 80 / 12 12 Telefaks: 73 59 70 51 Foretaksregisteret: NO 948 007 029 MVA Statfjord
RAPPORT. Forvitringsegenskaper på sjøen og kjemisk dispergerbarhet for Troll råolje. En håndbok for Norsk Hydro a.s
 RAPPORT TITTEL IKU Petroleumsforskning a.s Forvitringsegenskaper på sjøen og kjemisk dispergerbarhet for Troll råolje. En håndbok for Norsk Hydro a.s 7034 Trondheim Tel.: 07 59 11 00 Fax: 07 59 11 02 (aut.)
1 Bakgrunn Målsetting Generelt om fysikalsk-kjemiske egenskaper og kjemisk sammensetning til dieseloljer... 4
 Innholdsfortegnelse 1 Bakgrunn... 3 2 Målsetting... 4 3 Generelt om fysikalsk-kjemiske egenskaper og kjemisk sammensetning til dieseloljer... 4 4 Miljøeffekter fra tidligere hendelser med utslipp av diesel...
PETROLEUMSPRISRÅDET. NORM PRICE FOR ALVHEIM AND NORNE CRUDE OIL PRODUCED ON THE NORWEGIAN CONTINENTAL SHELF 1st QUARTER 2016
 1 PETROLEUMSPRISRÅDET Deres ref Vår ref Dato OED 16/716 22.06.2016 To the Licensees (Unofficial translation) NORM PRICE FOR ALVHEIM AND NORNE CRUDE OIL PRODUCED ON THE NORWEGIAN CONTINENTAL SHELF 1st QUARTER
Oljevernberedskap i Barentshavet Status og utfordringer
 Oljevernberedskap i Barentshavet Status og utfordringer Per Johan Brandvik, Dr.Scient. per.brandvik@sintef.no Seniorforsker, Marin miljøteknologi, SINTEF Professor, Marin miljøkjemi, NTNU www.og21.no Fra
INNHOLDSFORTEGNELSE Innledning og hovedkonklusjoner... 4 Råoljers sammensetning, egenskaper og oppførsel på vann... 6
 2 INNHOLDSFORTEGNELSE 1 Innledning og hovedkonklusjoner...4 1.1 Innledning...4 1.2 Hovedkonklusjoner...5 2 Råoljers sammensetning, egenskaper og oppførsel på vann...6 2.1 Kjemisk sammensetning av råoljer...6
Statlig dispergeringsberedskap. Kystnær dispergering av bunkersolje
 Kystnær dispergering av bunkersolje Juli 2014 Innholdsfortegnelse 1 Innhold Innholdsfortegnelse... 1 Definisjoner og forkortelser... 4 Sammendrag... 5 Summary... 8 1 Innledning... 11 1.1 Bakgrunn for
FORFATTER(E) OPPDRAGSGIVER(E) Statoil GRADER. DENNE SIDE ISBN PROSJEKTNR. ANTALL SIDER OG BILAG
 OPPDRAGSGIVER(E) Statoil GRADER. DENNE SIDE ISBN PROSJEKTNR. ANTALL SIDER OG BILAG") SINTEF RAPPORT TITTEL SINTEF Kjemi Postadresse: 7465 Trondheim Besøksadresse: S.P. Andersens vei 15A Telefon: 73 59 2 8 / 12 12 Telefaks: 73 59 7 51 Foretaksregisteret: NO 948 7 29 MVA Åsgard A, Smørbukk,
SINTEF RAPPORT TITTEL SINTEF Kjemi Postadresse: 7465 Trondheim Besøksadresse: S.P. Andersens vei 15A Telefon: 73 59 2 8 / 12 12 Telefaks: 73 59 7 51 Foretaksregisteret: NO 948 7 29 MVA Åsgard A, Smørbukk,
Forskerseminar Havet og kysten PROOFNY & OLF. Toril Røe Utvik Einar Lystad
 Forskerseminar Havet og kysten PROOFNY & OLF Toril Røe Utvik Einar Lystad Rapportering av utslipp Rapporteringsfrist 1. mars Felles tall for Klif, OD og OLF Viser statistikk for: Produsert olje, kondensat
FORFATTER(E) OPPDRAGSGIVER(E) Statoil GRADER. DENNE SIDE ISBN PROSJEKTNR. ANTALL SIDER OG BILAG
 OPPDRAGSGIVER(E) Statoil GRADER. DENNE SIDE ISBN PROSJEKTNR. ANTALL SIDER OG BILAG") SINTEF RAPPORT TITTEL SINTEF Kjemi Postadresse: 7034 Trondheim Besøksadresse: S.P. Andersens vei 15A Telefon: 73 59 28 73 Telefaks: 73 59 70 51 Foretaksnr.: NO 948 007 029 MVA Forvitringsegenskaper for
SINTEF RAPPORT TITTEL SINTEF Kjemi Postadresse: 7034 Trondheim Besøksadresse: S.P. Andersens vei 15A Telefon: 73 59 28 73 Telefaks: 73 59 70 51 Foretaksnr.: NO 948 007 029 MVA Forvitringsegenskaper for
Software applications developed for the maritime service at the Danish Meteorological Institute
 Software applications developed for the maritime service at the Danish Meteorological Institute Anne Marie Munk Jørgensen (ammj@dmi.dk), Ove Kjær, Knud E. Christensen & Morten L. Mortensen Danish Meteorological
INNHOLDSFORTEGNELSE Del 1 Forvitringsegenskaper til Kvitebjørn... 4 Innledning... 4 Råoljers sammensetning, egenskaper og oppførsel på sjøen...
 2 INNHOLDSFORTEGNELSE Del 1 Forvitringsegenskaper til Kvitebjørn...4 1 Innledning...4 2 Råoljers sammensetning, egenskaper og oppførsel på sjøen...5 2.1 Kjemisk sammensetning av råoljer...5 2.1.1 Hydrokarboner...5
FORFATTER(E) Janne Lise Myrhaug Resby OPPDRAGSGIVER(E) Statoil GRADER. DENNE SIDE ISBN PROSJEKTNR. ANTALL SIDER OG BILAG
 Janne Lise Myrhaug Resby OPPDRAGSGIVER(E) Statoil GRADER. DENNE SIDE ISBN PROSJEKTNR. ANTALL SIDER OG BILAG") SINTEF RAPPORT TITTEL SINTEF Materialer og kjemi Postadresse: 7465 Trondheim Besøksadresse: S.P. Andersens vei 15A Telefon: 73 59 2 8 / 12 12 Telefaks: 73 59 7 51 Foretaksregisteret: NO 948 7 29 MVA Snorre
SINTEF RAPPORT TITTEL SINTEF Materialer og kjemi Postadresse: 7465 Trondheim Besøksadresse: S.P. Andersens vei 15A Telefon: 73 59 2 8 / 12 12 Telefaks: 73 59 7 51 Foretaksregisteret: NO 948 7 29 MVA Snorre
Notat. 1 Bakgrunn. 2 Resultater fra miljørisikoanalysen Statoil ASA TPD TEX SST ETOP VVAL Vibeke Hatlø
 Notat Statoil ASA TPD TEX SST ETOP VVAL 2015-02-17 Til Vibeke Hatlø Kopi Anne-Lise Heggø, Louise-Marie Holst Fra Vilde Krey Valle Sak Vurdering av fortsatt gyldighet av miljørisikoanalysen for Volve fra
Oppfølging av norsk beredskapsutvikling basert på Macondoutslippet
 Oppfølging av norsk beredskapsutvikling basert på Macondoutslippet Når ulykker truer miljøet 17. februar 2011 Sjefingeniør Kirsti Natvig Beredskap i kyst og strandsone 15. april 2010 Oppdateringen av kunnskapsgrunnlaget
FORFATTER(E) Frode Leirvik OPPDRAGSGIVER(E) Statoil GRADER. DENNE SIDE ISBN PROSJEKTNR. ANTALL SIDER OG BILAG
 Frode Leirvik OPPDRAGSGIVER(E) Statoil GRADER. DENNE SIDE ISBN PROSJEKTNR. ANTALL SIDER OG BILAG") SINTEF RAPPORT TITTEL SINTEF Materialer og kjemi Postadresse: 7465 Trondheim Besøksadresse: Brattørkaia 17B, 4etg. Telefon: 4000 3730 Telefaks: 930 70 730 Foretaksregisteret: NO 948 007 029 MVA Kristin
SINTEF RAPPORT TITTEL SINTEF Materialer og kjemi Postadresse: 7465 Trondheim Besøksadresse: Brattørkaia 17B, 4etg. Telefon: 4000 3730 Telefaks: 930 70 730 Foretaksregisteret: NO 948 007 029 MVA Kristin
BioCarb+ NFR KPN prosjekt MNOK. Enabling the biocarbon value chain for energy
 Enabling the biocarbon value chain for energy BioCarb+ Dr. Ing. Øyvind Skreiberg Sjefforsker, SINTEF Energi AS BioCarb+ prosjektleder oyvind.skreiberg@sintef.no http://www.sintef.no/biocarb NFR KPN prosjekt
Krav til fartøy som har fast installert utstyr for dispergering
 Norsk Oljevernforening For Operatørselskap (NOFO) NOFO STANDARD 2009 VEDLEGG C Krav til fartøy som har fast installert utstyr for dispergering Utgitt oktober 2010 Rev. 01, mai 2011 Innhold Forord 1 INNLEDNING
C13 Kokstad. Svar på spørsmål til kvalifikasjonsfasen. Answers to question in the pre-qualification phase For English: See page 4 and forward
 C13 Kokstad Svar på spørsmål til kvalifikasjonsfasen Answers to question in the pre-qualification phase For English: See page 4 and forward Norsk Innhold 1. Innledning... 2 2. Spørsmål mottatt per 28.11.12...
Revidert versjon FORFATTER(E) OPPDRAGSGIVER(E) Statoil GRADER. DENNE SIDE ISBN PROSJEKTNR. ANTALL SIDER OG BILAG
 OPPDRAGSGIVER(E) Statoil GRADER. DENNE SIDE ISBN PROSJEKTNR. ANTALL SIDER OG BILAG") SINTEF RAPPORT TITTEL SINTEF Kjemi Postadresse: 7465 Trondheim Besøksadresse: S.P. Andersens vei 15A Telefon: 73 59 20 80 / 12 12 Telefaks: 73 59 70 51 Foretaksregisteret: NO 948 007 029 MVA Statfjord
SINTEF RAPPORT TITTEL SINTEF Kjemi Postadresse: 7465 Trondheim Besøksadresse: S.P. Andersens vei 15A Telefon: 73 59 20 80 / 12 12 Telefaks: 73 59 70 51 Foretaksregisteret: NO 948 007 029 MVA Statfjord
Gaute Langeland September 2016
 Gaute Langeland September 2016 Svak krone 10,4 10 9,6 9,2 8,8 8,4 EURNOK 8 7,6 7,2 6,8 3jan00 3jan02 3jan04 3jan06 3jan08 3jan10 3jan12 3jan14 3jan16 2 12.10.2016 Ikke helt tilfeldig 3 12.10.2016 Hvordan
Prosjektnotat. Tidevannsanalyse. 1 av 5. Sammenligning av harmoniske konstanter fra modell mot observasjoner
 SINTEF Fiskeri og havbruk AS Postadresse: Postboks 4762 Sluppen 7465 Trondheim Sentralbord: 40005350 Telefaks: 93270701 fish@sintef.no www.sintef.no/fisk Foretaksregister: NO 980 478 270 MVA Prosjektnotat
Klifs søknadsveileder
 Klifs søknadsveileder Resultater av det pågående arbeidet med hovedfokus på kravene om miljørisiko- og beredskapsanalyse Ingeborg Rønning Lokasjon og tidsperiode Analysene bør normalt gjennomføres slik
Typhoon Ventil: Syklonisk strømning gir renere produksjon
 Typhoon Ventil: Syklonisk strømning gir renere produksjon INNHOLD Teknologien Resultat fra fullskalatester Pilotinstallasjon Utviklingsprosjekt Typhoon Ventil, prototype TEKNOLOGIEN PROSJEKT HISTORIKK
Sammenheng mellom separasjonstog og produsertvann system. Anne Finborud, Mator AS
 Sammenheng mellom separasjonstog og produsertvann system Anne Finborud, Mator AS Produsertvann - et problem? Produsertvann salinitet og koalesens Zetapotensial mv Påvirkning av produsertvann salinitet
Oppdatering av gap-analyse av beredskapsbehov for akutt utslipp på Gjøa.
 TEKNISK N O T A T Sep. 2006 TIL Gjøa prosjektet v/ Kari Sveinsborg Eide KOPI Kåre Salte FRA SAK Anette Boye, T&P ANT HMST Oppdatering av gap-analyse av beredskapsbehov. Innhold 1 INNLEDNING... 3 2 BEREDSKAPSMESSIGE
UTSLIPPSDIAMETER (RELEASE DIAMETER)
") UTSLIPPSDIAMETER (RELEASE DIAMETER) Parameter navn Beskrivelse Release diameter The diameter of the release pipe in meters Standard verdi uten restriksjoner (cm) 47,63 Standardverdi med restriksjoner (cm)
UTSLIPPSDIAMETER (RELEASE DIAMETER) Parameter navn Beskrivelse Release diameter The diameter of the release pipe in meters Standard verdi uten restriksjoner (cm) 47,63 Standardverdi med restriksjoner (cm)
Rapport. Lavtemperaturegenskaper til HDPE. Strekktesting ved lave temperaturer. Forfatter(e) Frode Grytten
 Frode Grytten") SINTEF F25692 - Fortrolig Rapport Lavtemperaturegenskaper til HDPE Strekktesting ved lave temperaturer Forfatter(e) Frode Grytten SINTEF Materialer og kjemi Polymerer og komposittmaterialer 2014-06-02
SINTEF F25692 - Fortrolig Rapport Lavtemperaturegenskaper til HDPE Strekktesting ved lave temperaturer Forfatter(e) Frode Grytten SINTEF Materialer og kjemi Polymerer og komposittmaterialer 2014-06-02
What's in IT for me? Sted CAMPUS HELGELAND, MO I RANA Tid
 Pris kr. 490,- Påmelding til Tone på tj@kph.no Frist: 10. januar 2019 DET ER UTFORDRENDE Å FÅ AVGRENSET OG SATT MÅL FOR DIGITALISERINGSPROSJEKTER SOM GIR VERDI FOR VIRKSOMHETEN. SINTEF HELGELAND OG ARCTIC
Helgeland Havbruksstasjon AS
 Helgeland Havbruksstasjon AS Strømundersøkelse Klipen i Leirfjord kommune Juli 2014 Helgeland Havbruksstasjon Torolv Kveldulvsons gate 39 8800 Sandnessjøen are@havforsk.com, 90856043 Informasjon om anlegg
Strømning og spredning av gass i vann og overgang vann til luft
 Strømning og spredning av gass i vann og overgang vann til luft Seniorforsker Øistein Johansen SINTEF Marin miljøteknologi 1 Undervannsutblåsning av gass og olje Noen viktige teoretiske og eksperimentelle
Deepwater Horizon Erfaringer og oppfølging
 Deepwater Horizon Erfaringer og oppfølging Ptil s brev av 23.4.2012 Sikkerhetsforum 6. juni 2012 Deepwater Horizon Erfaringer og oppfølging Agenda: Prosjekt oversikt og sammendrag Forebygging av storulykker
OPPDRAGSGIVER(E) PROSJEKTLEDER. Merete Øverli Moldestad. Ivar Singsaas
 PROSJEKTLEDER. Merete Øverli Moldestad. Ivar Singsaas") RAPPORT IKU Petroleumsforskning a.s TITTEL Forvitringsegenskaper og kjemisk dispergerbarhet for Gullfaks C og Tordis råoljer. Blandingsolje av Gullfaks C og Tordis råoljer. Datarapport. 7034 Trondheim
RAPPORT IKU Petroleumsforskning a.s TITTEL Forvitringsegenskaper og kjemisk dispergerbarhet for Gullfaks C og Tordis råoljer. Blandingsolje av Gullfaks C og Tordis råoljer. Datarapport. 7034 Trondheim
INNHOLDSFORTEGNELSE Executive summary...4 1 Innledning... 5 2 Råoljers sammensetning, egenskaper og oppførsel på sjøen... 7 2.1 Kjemisk sammensetning
 2 INNHOLDSFORTEGNELSE Executive summary...4 1 Innledning... 5 2 Råoljers sammensetning, egenskaper og oppførsel på sjøen... 7 2.1 Kjemisk sammensetning av råoljer... 7 Hydrokarboner... 7 Organiske ikke-hydrokarboner...
Oljeforurensningsscenario:
 NOKIOS 2012 workshop: Nasjonal infrastruktur for stedsbasert informasjon som plattform for innovasjon Trondheim, 30. oktober 2012 Oljeforurensningsscenario: Hvordan kan en avansert simuleringsmodell for
Testing av epoksyasfalt
 Vegdirektoratet Trafikksikkerhet, miljø- og teknologiavdelingen Vegteknologi 29.08.2013 Testing av epoksyasfalt Varige veger 2011-2014 STATENS VEGVESENS RAPPORTER Nr. 241 Statens vegvesens rapporter NPRA
FORFATTER(E) OPPDRAGSGIVER(E) Norsk Hydro ASA GRADER. DENNE SIDE ISBN PROSJEKTNR. ANTALL SIDER OG BILAG. Fortrolig
 OPPDRAGSGIVER(E) Norsk Hydro ASA GRADER. DENNE SIDE ISBN PROSJEKTNR. ANTALL SIDER OG BILAG. Fortrolig") SINTEF RAPPORT TITTEL SINTEF Kjemi Postadresse: 7465 Trondheim Besøksadresse: S.P. Andersens vei 15A Telefon: 73 59 20 80 / 12 12 Telefaks: 73 59 70 51 Foretaksregisteret: NO 948 007 029 MVA Oseberg Sør
SINTEF RAPPORT TITTEL SINTEF Kjemi Postadresse: 7465 Trondheim Besøksadresse: S.P. Andersens vei 15A Telefon: 73 59 20 80 / 12 12 Telefaks: 73 59 70 51 Foretaksregisteret: NO 948 007 029 MVA Oseberg Sør
Utskiller teori Hvordan opptrer olje i vann Hvordan få best mulig renseeffekt i en gravimetrisk utskiller Sandfang funksjon
 Utskiller teori Hvordan opptrer olje i vann Hvordan få best mulig renseeffekt i en gravimetrisk utskiller Sandfang funksjon 1 Oversikt over tetthet i ulike lette væsker som vil kunne avskilles i en oljeutskiller
Konstruksjonsstål for arktiske forhold krav til sveisbarhet og egenskaper. Norsk Korrosjonsteknisk forening Mons Hauge, Statoil
 Konstruksjonsstål for arktiske forhold krav til sveisbarhet og egenskaper Norsk Korrosjonsteknisk forening 2016-06-02 Mons Hauge, Statoil The Arctic Materials Project Goals: Safe and cost-effective application
Rapport. Mekanisk dispergering av tynne oljefilmer. Oljevern 2015-WP048. Forfatter(e) SINTEF Ocean AS Miljøteknologi
 SINTEF Ocean AS Miljøteknologi") OC2017 A-125 - Unrestricted Rapport Mekanisk dispergering av tynne oljefilmer Oljevern 2015-WP048 Forfatter(e) Kristin R. Sørheim Per S. Daling og Frode Leirvik Sjøtest med MS Strilborg i Hammerfest (23-25
OC2017 A-125 - Unrestricted Rapport Mekanisk dispergering av tynne oljefilmer Oljevern 2015-WP048 Forfatter(e) Kristin R. Sørheim Per S. Daling og Frode Leirvik Sjøtest med MS Strilborg i Hammerfest (23-25
LETTBETONG I TUNNELHVELV Varmemotstand og varmekonduktivitet Lettbetongelementer - Væretunnelen
 LETTBETONG I TUNNELHVELV Varmemotstand og varmekonduktivitet Lettbetongelementer - Væretunnelen R A P P O R T Te k n o l o g i a v d e l i n g e n Nr: 2401 Seksjon for materialteknikk: 2005-07-21 TEKNOLOGI-RAPPORT
FORFATTER(E) Frode Leirvik OPPDRAGSGIVER(E) Norske Shell GRADER. DENNE SIDE ISBN PROSJEKTNR. ANTALL SIDER OG BILAG
 Frode Leirvik OPPDRAGSGIVER(E) Norske Shell GRADER. DENNE SIDE ISBN PROSJEKTNR. ANTALL SIDER OG BILAG") SINTEF RAPPORT TITTEL SINTEF Materialer og kjemi Postadresse: 7465 Trondheim Besøksadresse: Brattørkaia 17B, 4etg. Telefon: 4000 3730 Telefaks: 930 70 730 Foretaksregisteret: NO 948 007 029 MVA Draugen
SINTEF RAPPORT TITTEL SINTEF Materialer og kjemi Postadresse: 7465 Trondheim Besøksadresse: Brattørkaia 17B, 4etg. Telefon: 4000 3730 Telefaks: 930 70 730 Foretaksregisteret: NO 948 007 029 MVA Draugen
Sammenligning beredskapsdimensjonering for Goliat gammel og ny analyse og oljedriftsmodell
 NOTAT TIL: ENI Norge v/ Ole Hansen, Erik Bjørnbom NOTAT NR.: 12OYMZB-3/ BRUDE FRA: DNV KOPI: DATO: 2010-08-19 SAKSBEH.: Odd Willy Brude Sammenligning beredskapsdimensjonering for Goliat gammel og ny analyse
Validering av nytt spindelsystem CC17, Rheolab QC
 Rapport 42/2015 Utgitt oktober 2015 Validering av nytt spindelsystem CC17, Rheolab QC Tor-Arne Krakeli Nofima er et næringsrettet forskningsinstitutt som driver forskning og utvikling for akvakulturnæringen,
Mainstream Norway AS. Strømmålinger Ånderbakk m, 15m, Spredning, Bunn. Akvaplan-niva AS Rapport:
 Mainstream Norway AS Strømmålinger 5m, 5m, Spredning, Bunn Akvaplan-niva AS Rapport: 5558. This page is intentionally left blank Akvaplan-niva AS Rådgivning og forskning innen miljø og akvakultur Org.nr:
FNs klimapanels femte hovedrapport Del 1: Det naturvitenskapelige grunnlaget
 FNs klimapanels femte hovedrapport Del 1: Det naturvitenskapelige grunnlaget Rapporten beskriver observerte klimaendringer, årsaker til endringene og hvilke fysiske endringer vi kan få i klimasystemet
NORM PRICE FOR CRUDE OIL PRODUCED ON THE NORWEGIAN CONTINENTAL SHELF 1 st QUARTER 2015
 1 PETROLEUM PRICE BO ARD Our reference Date OED 15/712 15/06/2015 To the Licensees on the Norwegian Continental Shelf (Unofficial translation) NORM PRICE FOR CRUDE OIL PRODUCED ON THE NORWEGIAN CONTINENTAL
Klebing mellom asfaltlag
 Via Nordica 2016 FoU innen belegningsbransjen Norsk bidrag Klebing mellom asfaltlag Wenche Hovin Sentrallaboratoriet Trondheim Statens vegvesen Bakgrunn Prosjektet ble gjennomført i forbindelse med Statens
Wilsgård Fiskeoppdrett
 Wilsgård Fiskeoppdrett Strømmålinger Værnes m dyp AS Akvaplan-niva AS Rapport: 68. This page is intentionally left blank Akvaplan-niva AS Rådgivning og forskning innen miljø og akvakultur Org.nr: NO 97
Technical specification
 Jotspec Technical specification Dry Dock Owner: KYSTVERKET Vessel name: VILLA Yard: IMO: 7382641 Version: 1 Management: Hull no: 32 Date: 18.10.2016 Project: M/S VILLA DD 2017 Prepared by: Vidar Oldervik
Snøhvit kondensatet Forvitringsegenskaper FORFATTER(E) OPPDRAGSGIVER(E) Statoil ASA. STF66 F01111 Fortrolig Arne Myhrvold, Inge M.
 OPPDRAGSGIVER(E) Statoil ASA. STF66 F01111 Fortrolig Arne Myhrvold, Inge M.") SINTEF RAPPORT TITTEL SINTEF Kjemi Postadresse: 7465 Trondheim Besøksadresse: S.P. Andersens vei 15A Telefon: 73 59 2 8 / 12 12 Telefaks: 73 59 7 51 Foretaksregisteret: NO 948 7 29 MVA Snøhvit kondensatet
SINTEF RAPPORT TITTEL SINTEF Kjemi Postadresse: 7465 Trondheim Besøksadresse: S.P. Andersens vei 15A Telefon: 73 59 2 8 / 12 12 Telefaks: 73 59 7 51 Foretaksregisteret: NO 948 7 29 MVA Snøhvit kondensatet
Kartleggingsskjema / Survey
 Kartleggingsskjema / Survey 1. Informasjon om opphold i Norge / Information on resident permit in Norway Hvilken oppholdstillatelse har du i Norge? / What residence permit do you have in Norway? YES No
SalMar Nord. Strømmålinger Øyra 5m, 15m, spredning, bunn. Akvaplan-niva AS Rapport: 6587.03
 SalMar Nord Strømmålinger Øyra 5m, m, spredning, bunn Akvaplan-niva AS Rapport: 6587.3 This page is intentionally left blank Akvaplan-niva AS Rådgivning og forskning innen miljø og akvakultur Org.nr: NO
RAPPORT. Bodalstranda Strømnings- og sprangsjiktsutredning Isesjø OPPDRAGSNUMMER SWECO NORGE AS
 Bodalstranda Strømnings- og sprangsjiktsutredning Isesjø OPPDRAGSNUMMER 21545001 SWECO NORGE AS FREDRICK MARELIUS KVALITETSSIKRET AV PETTER STENSTRÖM KARIN ANJA ARNESEN Sweco 2 (12) Endringslogg VER. DATO
Krav i dagens regelverk til faglig vurdering av dispergering
 Krav i dagens regelverk til faglig vurdering av dispergering Workshop dispergering NOFO 15.12.2011 Kirsti Natvig forurensningsforskriften Kap 19 om sammensetning og bruk av dispergeringsmidler og strandrensemidler
GOE-IP AS- GlobalOrganicEnergy-Intelligent Property AS
 GOE-IP AS- GlobalOrganicEnergy-Intelligent Property AS Projects: 1. Microbial Selective Plugging MSP (Sandstone - reservoirs) 2. Particle Fracture Blocking PFB (Karbonat - reservoirs) 3. Upscaling/Meso
Tilstandskontroll av sprøytebetong
 Vegdirektoratet Trafikksikkerhet, miljø- og teknologiavdelingen Tunnel og betong November 2016 Tilstandskontroll av sprøytebetong i sju tunneler Etatsprogrammet Varige konstruksjoner 2012-2015 STATENS
Grieg Seafood Finnmark
 Grieg Seafood Finnmark Strømmålinger 5m, m, spredning, bunn Akvaplan-niva AS Rapport: 7171.1 This page is intentionally left blank Akvaplan-niva AS Rådgivning og forskning innen miljø og akvakultur Org.nr:
Subsea flerfasemåling. Kåre Kleppe Specialist Pipeline Technology SMT PTT FA Statoil ASA Classification: Internal 2012-01-18
 Subsea flerfasemåling Kåre Kleppe Specialist Pipeline Technology ST PTT FA Statoil ASA Topics Innledning Hvorfor må vi ha et overordnet system Typisk design. Flerfasemålere brukt til allokeringsmåling.
Passasjerer med psykiske lidelser Hvem kan fly? Grunnprinsipper ved behandling av flyfobi
 Passasjerer med psykiske lidelser Hvem kan fly? Grunnprinsipper ved behandling av flyfobi Øivind Ekeberg 5.september 2008 Akuttmedisinsk avdeling, Ullevål universitetssykehus Avdeling for atferdsfag, Universitetet
Finansieringsmuligheter i EU - noen eksempler
 Finansieringsmuligheter i EU - noen eksempler Frode Braadland EU rådgiver Innovasjon Norge Agder Eyde-nettverket, 23.03.2010 Finansieringsmuligheter i EU 3 virkemidler for næringslivet Eco-innovation Intelligent
Oppgave 3. Fordampningsentalpi av ren væske
 Oppgave 3 Fordampningsentalpi av ren væske KJ1042 Rom C2-107 Gruppe 45 Anders Leirpoll & Kasper Linnestad andersty@stud.ntnu.no kasperjo@stud.ntnu.no 29.02.2012 i Sammendrag I forsøket ble damptrykket
Strøm og Bølger, Sistranda
 Til: Fra: Onno Musch Dato 2017-02-28 Strøm og Bølger, Sistranda Massene som skal mudres fra området innenfor moloene, er planlagt deponert i et deponi område like utenfor moloåpningen, som vist i Figur
NKS-programmet Status i B-delen
 NKS-programmet Status i B-delen NKS Styrelsesmøtet 9.11.2006 Ole Harbitz NKS-B ressursfordeling: Ressursfordeling splittet på land: Ressursfordeling splittet på land og fagområde: Evalueringskriterier
FNs klimapanels femte hovedrapport Del 1: Det naturvitenskapelige grunnlaget
 FNs klimapanels femte hovedrapport Del 1: Det naturvitenskapelige grunnlaget Rapporten beskriver observerte klimaendringer, årsaker til endringene og hvilke fysiske endringer vi kan få i klimasystemet
Vår dato Vår referanse Vår saksbehandler AU-HVF Nina Skjegstad Deres dato Deres referanse Statoil Petroleum AS
 1 av 5 Miljødirektoratet Postboks 5672 Sluppen 7485 Trondheim Statoil Veslefrikk - Oppdatert søknad om endrede krav til fjernmåling Det vises til e-post fra Miljødirektoratet datert 13.12.2016, der det
Rapport. Analyse av kammertørke med varmepumpe i bypass. Rasjonell klippfisktørking. Forfatter(e) Erlend Indergård.
 Erlend Indergård.") Åpen Rapport Analyse av kammertørke med varmepumpe i bypass (L5b) Rasjonell klippfisktørking Forfatter(e) Erlend Indergård. SINTEF Energi AS Effektiv energibruk 2015 04 22 Historikk DATO SBESKRIVELSE
Åpen Rapport Analyse av kammertørke med varmepumpe i bypass (L5b) Rasjonell klippfisktørking Forfatter(e) Erlend Indergård. SINTEF Energi AS Effektiv energibruk 2015 04 22 Historikk DATO SBESKRIVELSE
FORFATTER(E) OPPDRAGSGIVER(E) Norsk Hydro ASA ELEKTRONISK ARKIVKODE PROSJEKTLEDER (NAVN, SIGN.) VERIFISERT AV (NAVN, SIGN.)
 OPPDRAGSGIVER(E) Norsk Hydro ASA ELEKTRONISK ARKIVKODE PROSJEKTLEDER (NAVN, SIGN.) VERIFISERT AV (NAVN, SIGN.)") TITTEL SINTEF RAPPORT SINTEF Kjemi Postadresse: 7034 Trondheim Besøksadresse: S.P. Andersens vei 15A Telefon: 73 59 28 73 Telefaks: 73 59 70 51 Foretaksnr.: NO 948 007 029 MVA OSEBERG ØST RÅOLJE: Egenskaper
TITTEL SINTEF RAPPORT SINTEF Kjemi Postadresse: 7034 Trondheim Besøksadresse: S.P. Andersens vei 15A Telefon: 73 59 28 73 Telefaks: 73 59 70 51 Foretaksnr.: NO 948 007 029 MVA OSEBERG ØST RÅOLJE: Egenskaper
Tor Haakon Bakken. SINTEF Energi og NTNU
 Tor Haakon Bakken SINTEF Energi og NTNU Plan for lynforedrag Energi-indikatorer Vannforbruk Sammenligning stort, smått og vind Multi-kriterieanalyse Sammenligning mellom prosjekter og teknologier Verktøy
Cermaq Norway AS. Strømmålinger Hjartøy 2014 Vanntransport, spredning og bunn. Akvaplan-niva AS Rapport:
 Cermaq Norway AS Strømmålinger 21 Vanntransport, spredning og bunn Akvaplan-niva AS Rapport: 7391.1 Akvaplan-niva AS Rådgivning og forskning innen miljø og akvakultur Org.nr: NO 937 375 158 MVA Framsenteret
Norsk Oljevernforening For Operatørselskap. Oljevern Prosjekter for nordområdene
 Norsk Oljevernforening For Operatørselskap Oljevern 2015 Prosjekter for nordområdene 04.04.17 Generelt Samarbeid mellom Kystverket og NOFO, annonsert 14. september 2014 Tredelt finansiering gjennom egeninnsats
Hirtshals prøvetank rapport
 Hirtshals prøvetank rapport 1. Innledning Vi gjennomført en rekke tester på en nedskalert versjon av en dobbel belg "Egersund 72m Hex-mesh" pelagisk trål. Testene ble utført mellom 11. og 13. august 21
Klima i Norge 2100 Kunnskapsgrunnlag for klimatilpassing
 Klima i Norge 2100 Kunnskapsgrunnlag for klimatilpassing Asgeir Sorteberg Geofysisk Institutt, UiB Bjerknessenteret, UiB The size of this warming is broadly consistent with predictions The balance of climate
Fokus vil bli rettet mot: Flokkulant Emulsjonsbryter Skumdemper Korrosjonsinhibitor
 Uheldig bruk av kjemikalier og konsekvenser TEKNA Separasjonsteknologi, 30.09 09-01.10 10 2009 Jon Berntsen, Mator AS Uheldig bruk av kjemikalier og konsekvenser Bruken av produksjonskjemikalier i oljeindustrien
Vurderinger omkring skader i våtdekk på katamaranen "Frøy Viking" Bjørn Bratfoss (Statens havarikommisjon for transport - SHT) DATO
 DATO") SINTEF Ocean AS Postboks 4762 Sluppen NO-7465 Trondheim Notat Sentralbord:+47 46 41 50 00 Telefaks: +47 73 59 57 76 ocean@sintef.no www.sintef.no/ocean NO 937 357 370 MVA Vurderinger omkring skader i våtdekk
SINTEF Ocean AS Postboks 4762 Sluppen NO-7465 Trondheim Notat Sentralbord:+47 46 41 50 00 Telefaks: +47 73 59 57 76 ocean@sintef.no www.sintef.no/ocean NO 937 357 370 MVA Vurderinger omkring skader i våtdekk
Effektstudien Oppfølging i 2009? Kort presentasjon (1) DØ,
 DØ,") Effektstudien 1990-94 Oppfølging i 2009? Kort presentasjon (1) DØ, 2008-10-14 Mål: Effektstudien ble gjennomført for å bestemme virkningen av utslipp på omgivelsene rundt smelteverkene i Norge. Hovedmål
Effektstudien 1990-94 Oppfølging i 2009? Kort presentasjon (1) DØ, 2008-10-14 Mål: Effektstudien ble gjennomført for å bestemme virkningen av utslipp på omgivelsene rundt smelteverkene i Norge. Hovedmål
Sterk global konkurranse, raske teknologiskift og det grønne skiftet utfordrer dagens løsninger og produksjonsmetoder.
 Sterk global konkurranse, raske teknologiskift og det grønne skiftet utfordrer dagens løsninger og produksjonsmetoder. Evnen til raskt å ta i bruk ny teknologi og nye metoder er avgjørende for bedriftens
Luftfartstilsynets funn under virksomhetstilsyn.
 Luftfartstilsynets funn under virksomhetstilsyn. Inkludert funn ifm EASA standardiseringspeksjon av Luftfartstilsynet. Luftfartstilsynet T: +47 75 58 50 00 F: +47 75 58 50 05 postmottak@caa.no Postadresse:
Teknologi og forskningslære
 Teknologi og forskningslære Problemstilling: Hva skal til for at Store Lungegårdsvanet blir dekket av et 30cm tykt islag? Ingress: Jeg valgte å forske på de første 30cm i Store Lungegårdsvannet. akgrunnen
Smart High-Side Power Switch BTS730
 PG-DSO20 RoHS compliant (green product) AEC qualified 1 Ω Ω µ Data Sheet 1 V1.0, 2007-12-17 Data Sheet 2 V1.0, 2007-12-17 Ω µ µ Data Sheet 3 V1.0, 2007-12-17 µ µ Data Sheet 4 V1.0, 2007-12-17 Data Sheet
NO X -chemistry modeling for coal/biomass CFD
 NO X -chemistry modeling for coal/biomass CFD Jesper Møller Pedersen 1, Larry Baxter 2, Søren Knudsen Kær 3, Peter Glarborg 4, Søren Lovmand Hvid 1 1 DONG Energy, Denmark 2 BYU, USA 3 AAU, Denmark 4 DTU,
Godkjenning av hydrogen som drivstoff på skip
 Godkjenning av hydrogen som drivstoff på skip Kolbjørn Berge Sjøfartsdirektoratet Innhold Nasjonalt regelverk Internasjonalt regelverk IGF Alternativt design MSC.1/Circ.1455 - Guidelines for the approval
Bruk av dispergeringsmidler som beredskapstiltak Veiledning
 M-747 2017 VEILEDER Bruk av dispergeringsmidler som beredskapstiltak Veiledning KOLOFON Utførende institusjon SINTEF Oppdragstakers prosjektansvarlig Per Daling Kontaktperson i Miljødirektoratet Gro D.